Yearly Dashboard
The Yearly Success Report has been developed for teachers to better understand how their classes perform on a yearly basis. It reveals the overall progress made by the class through the year.
The report consists of four main sections: Class Distribution, Overall Progress, Next Grade Readiness and Student Progress Tab.
Class Distribution
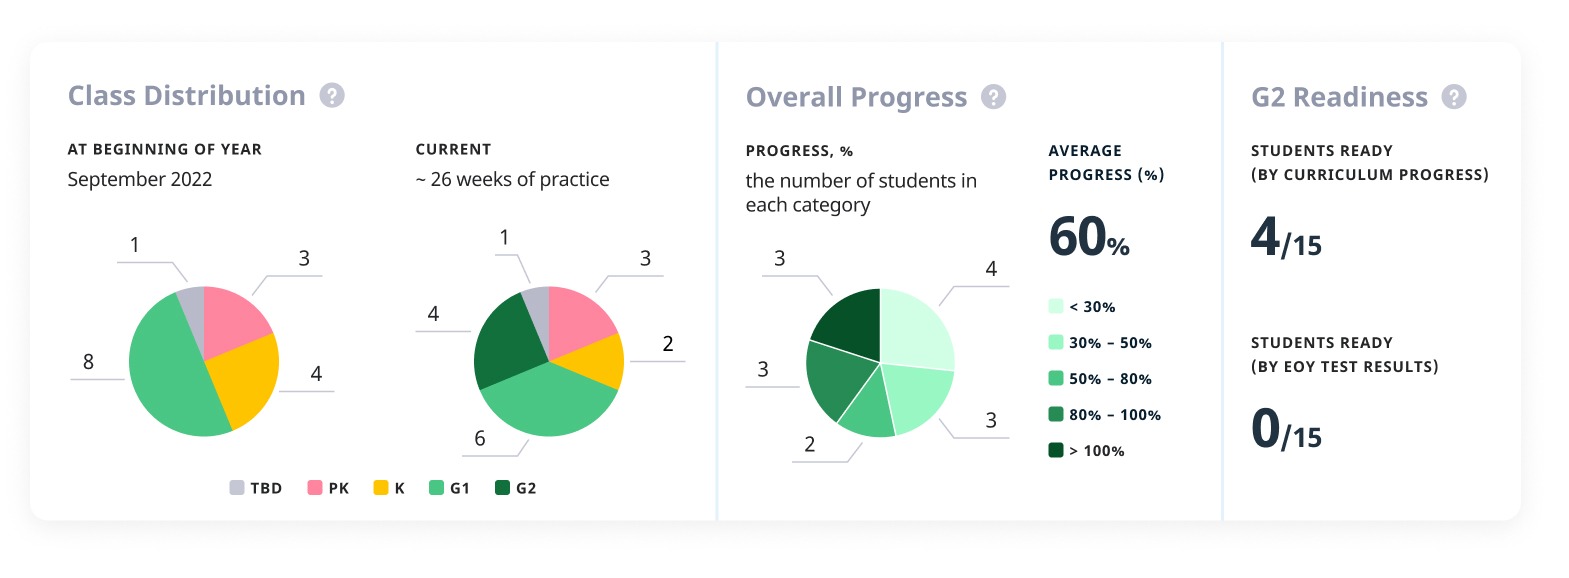
These diagrams display data on class distribution at the beginning of the year and the current week. Let’s see how a teacher can read the data from the diagrams:
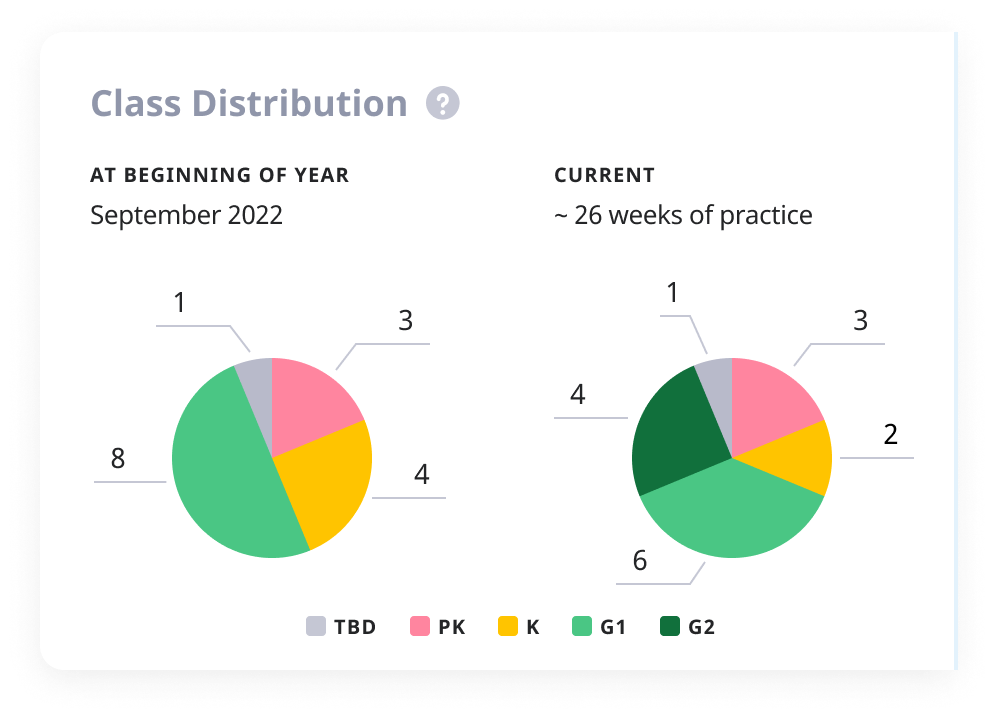
At the beginning of year:
-
TBD means that a student did not take the Placement Test yet. There is 1 student in this segment.
-
3 students were placed in Pre-K
-
4 students were placed in Kindergarten
-
8 students were placed in Grade 1
Current week:
-
1 student has not taken the Placement Test yet
-
3 students are working in Pre-K
-
2 students are working in Kindergarten
-
6 students are working in Grade 1
-
4 students are working in Grade 2
Overall Progress and Next Grade Readiness
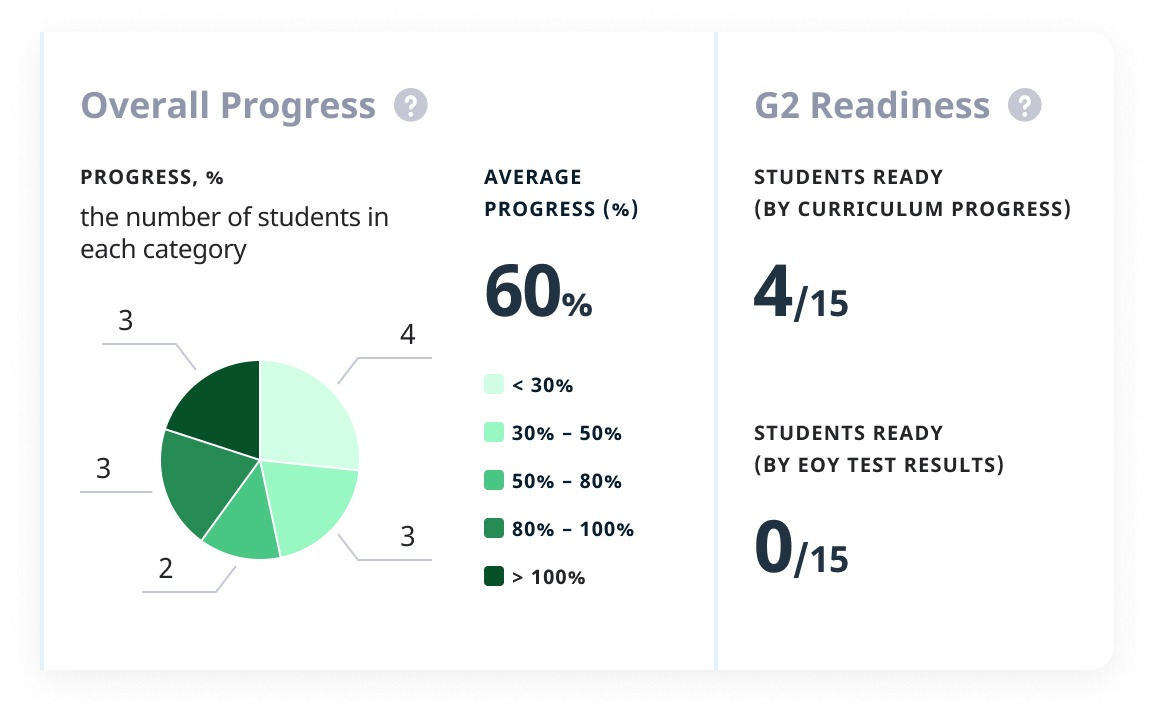
This section represents the data on the progress made through the Happy Numbers curriculum by the entire class. It shows average progress as a percentage of the curriculum and the number of students ready for the next grade. The pie chart breaks the class down into groups based on percentage progress. Below is an example of the class data teachers can find in the Progress section:
-
On average, the class has advanced through 60% of the curriculum based only on students who took the Placement Test (the entire grade curriculum is 100%).
-
4 students are ready for the next grade based on the curriculum progress and have already started working on tasks from the next grade. The total number of students (15) includes all the students enrolled, even those who did not take the Placement Test.
-
The chart shows the number of students in the following progress categories:
-
4 students have progressed by less than 30%
-
3 students have progressed between 30% and 49%
-
2 students have progressed between 50% and 79%
-
3 students have progressed between 80% and 100%
-
3 students have progressed beyond the end of the grade curriculum
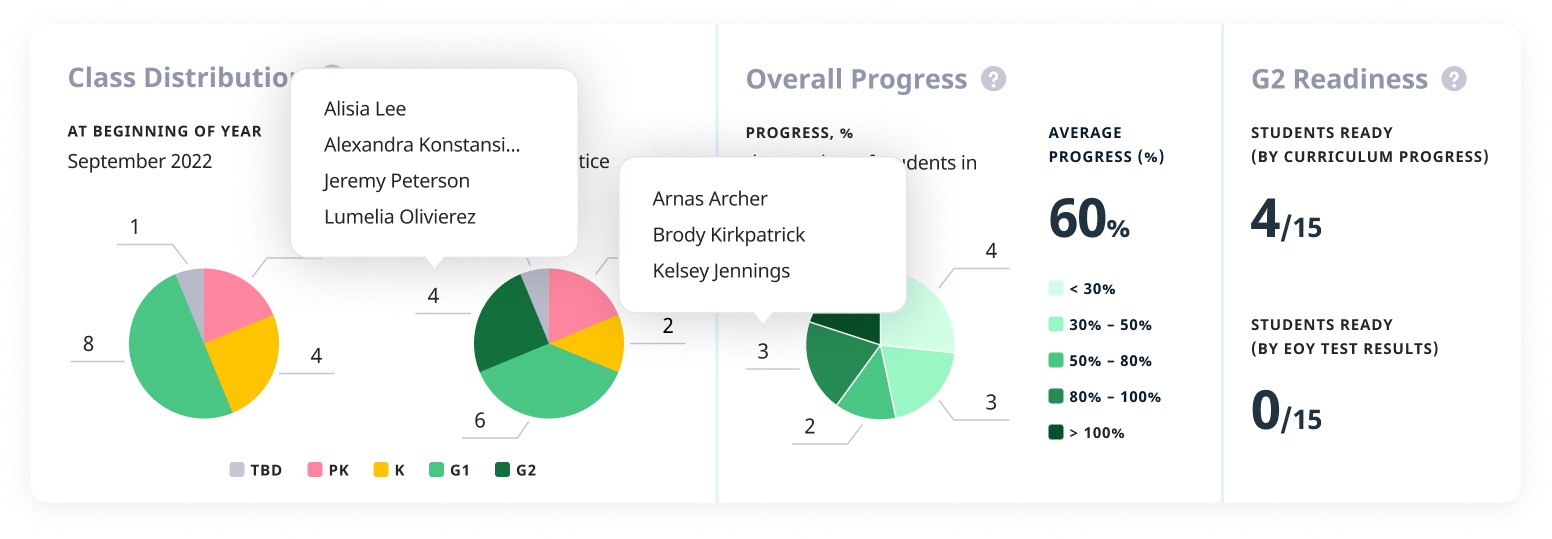
By hovering over sections of the diagram, you can see the names of students in that section.
Next Grade Readiness
This section shows the number of students ready for the next grade based on the curriculum progress made and EOY test results. For example, your students might be not advancing too much within the curriculum, though they might be ready for the next grade based on the test results, and vice versa.
The chart above displays the following data:
-
4 students are ready for Grade 2 based on the progress made
-
no students are ready based on the End-of-Year test results
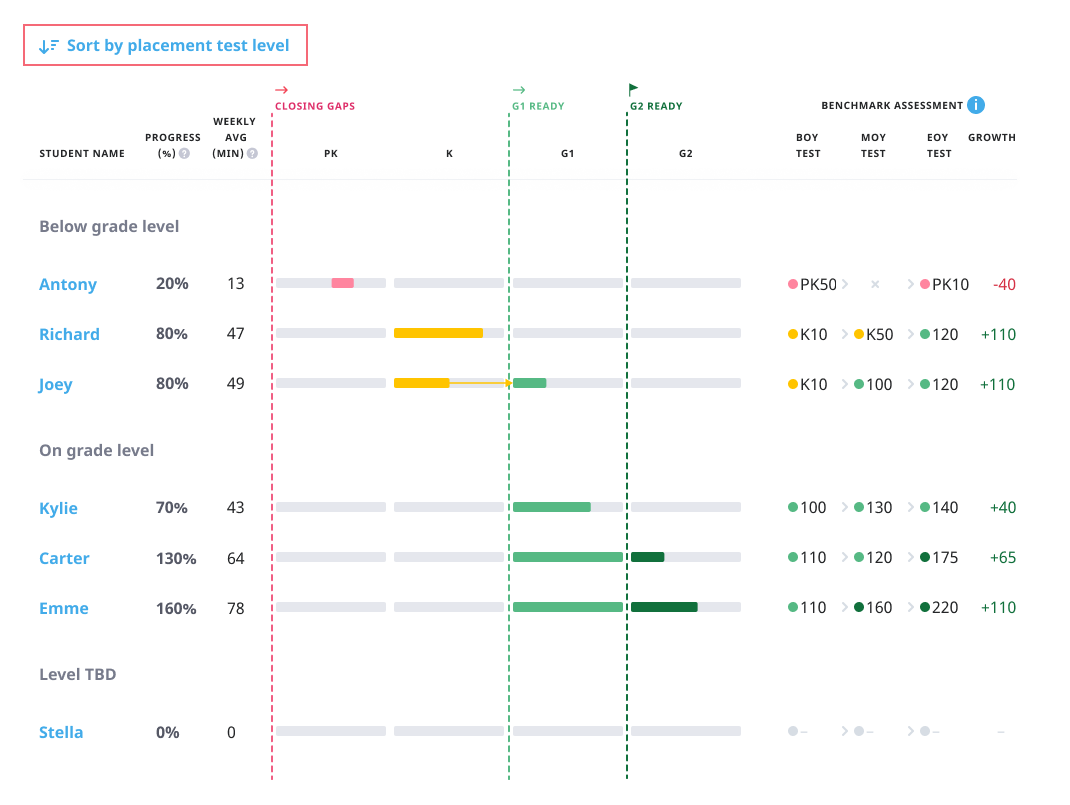
Student Progress Data Tab
This section displays student progress data, and teachers can sort it by four indicators:
-
Placement Test (default sorting indicator). There are three PT level types: below grade, on grade, TBD (test not taken yet)
-
Current grade level based on the progress made since the individual starting point from high to low
-
Time spent (weekly time) from high to low
-
Student name
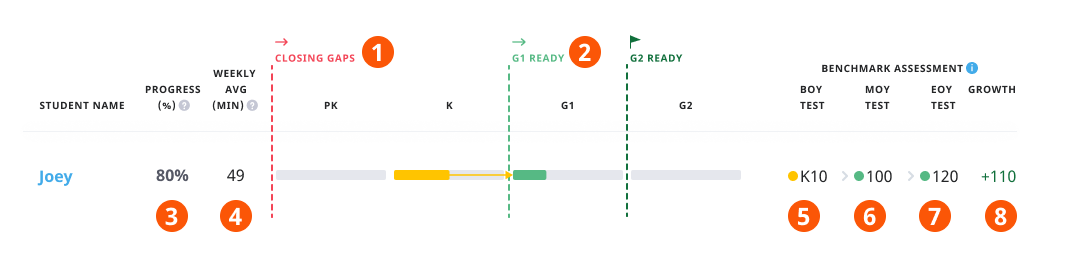
Let’s see how a teacher can interpret a particular student’s data below:
-
Joey began the Happy Numbers curriculum placed at Kindergarten based on the Placement Test result, as shown in the Closing Gaps section.
-
He has been moved to Grade 1 based on the Mid-Year Assessment result and has already completed 30% of the Grade 1 curriculum. The red arrow always indicates that a student has been pushed to the next level based on the Mid-Year Assessment result.
-
The progress Joey made since the curriculum starting point is 80%.
-
On average, he spends 49 minutes weekly.
-
Placement Test score is K10
-
Mid-Year Assessment score 100
-
End-of-Year Assessment score is 120
-
The progress made is compared to the Placement Test results. Joey’s yearly growth score is +110, which comes from K10 at the beginning of the year compared to 120 at the end of the year.
If you are also looking to check your weekly class data, please read our article Teacher Weekly Dashboard.
Should you like to save this information, click "PDF" to download it. You can either share a downloaded PDF via email or print it.
If you have any questions about reports, please reach out to us either on live chat or at support@happynumbers.com.
Access to the Yearly and Weekly Dashboards is limited if you have a Basic Classroom license. To learn more about the differences between license types and what features are available, please visit this page.