Weekly Dashboard
This dashboard lets a teacher check how individual students or a whole class performs during the week. It consists of two permanent and one dynamic main parts: a section for stuck students, a diagram section with a summary of class activities, and a diagram displaying individual student details.
Stuck Students
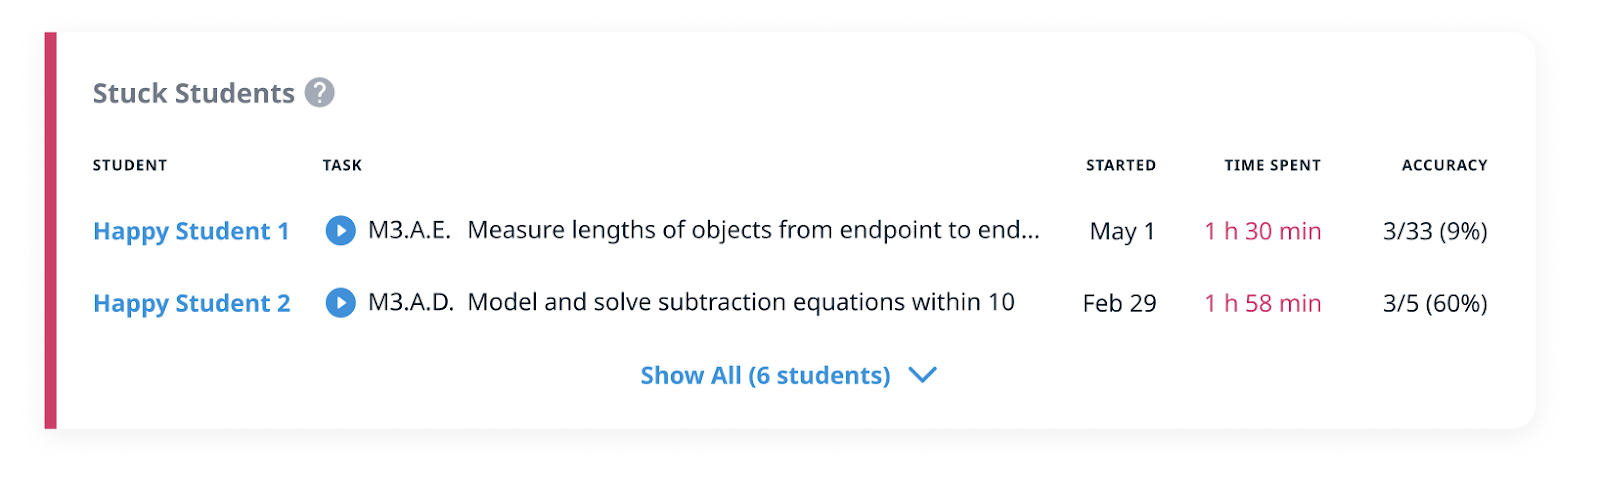
This section displays the students who are taking longer than expected to complete a task and have not finished it yet.
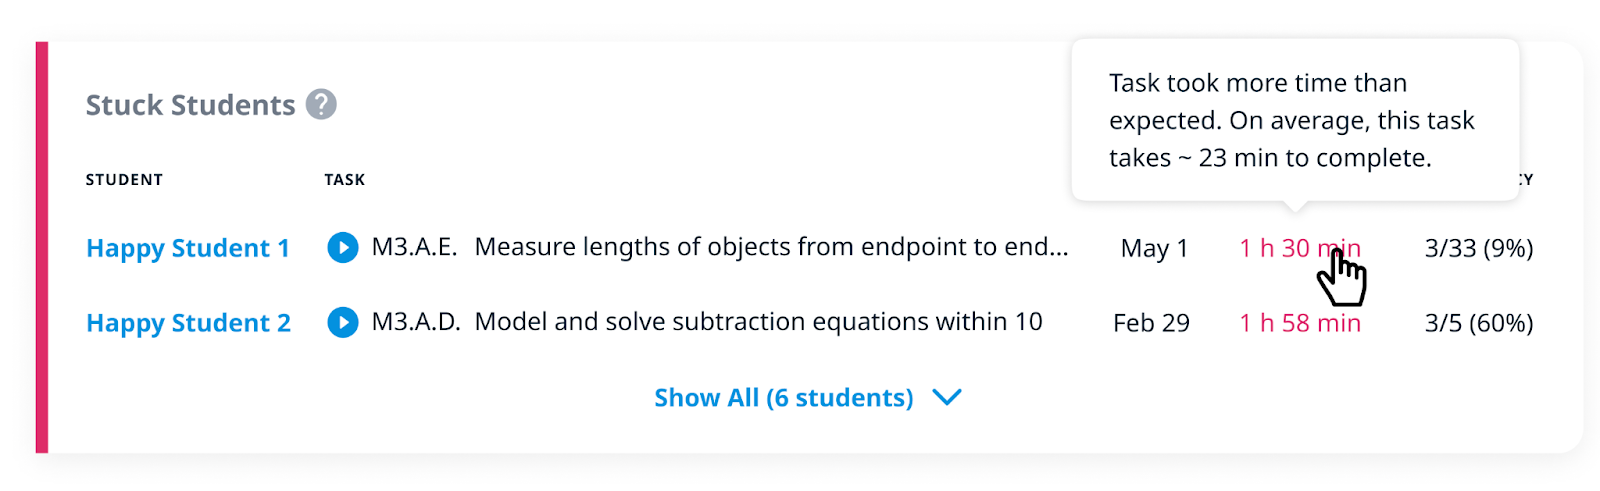
You can view the average time by hovering over the student's time.
Once students complete the task, they will be removed from the list. This block will not be displayed if no students have time management issues.
For more information about Stuck Students, please refer to this article.
Class Activity Diagram
This panel displays class Activity and Target Completion.
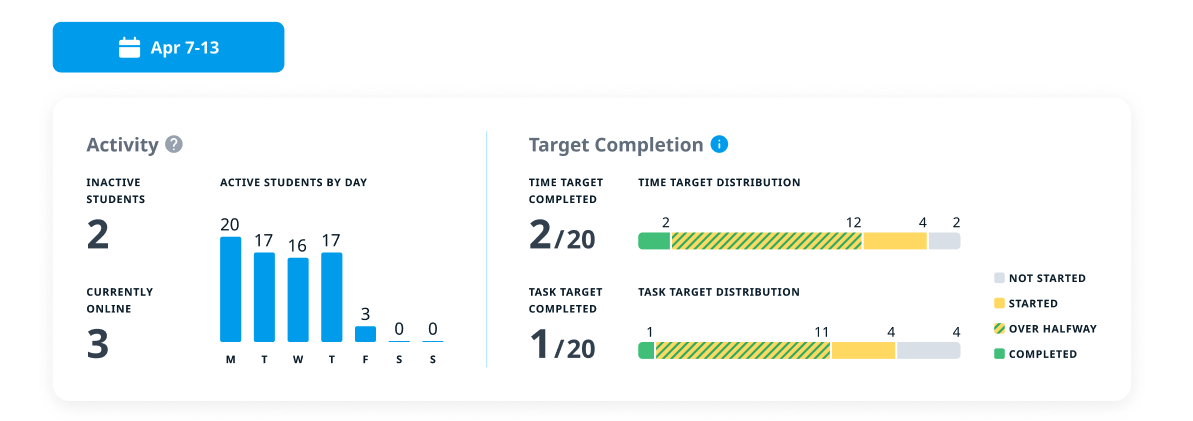
Activity Section
The Activity section lets a teacher see how many students stayed active (logged in) during the week and on which days. It also displays the total number of inactive students (those who didn’t log in at all) and the number of students currently online. To see the names of active students and spot those who achieved the target, hover over a particular data point.
Target Completion Section
The Target Completion section lets teachers check the achievement of Time and Task Targets.
Time Target
The data indicates the total number of students who completed the weekly Time Target. Teachers can hover over this number to see student names. By default, the Weekly Time Target is set to 30 minutes for Pre-K, 35 minutes for Kindergarten, and 45 minutes for Grades 1 and above. We recommend sticking with these grade-based defaults to help students achieve at least one year of growth by the end of the school year. However, a teacher can change the Weekly Time Target in the Control Panel.
Find out more about setting up your Weekly Target in How to Use Weekly Targets?
Important: The time a student spends working on Teacher Assignments is also taken into account in the Weekly Report's Time Target.
Task Target
Task Target is the minimum number of weekly tasks that students are expected to complete. It is calculated based on a student's assignment and Time Target. Data is displayed as a total number of students who completed the target and a diagram showing stages of completion. Again, hovering over a data point shows student details.
Note: By default, the reports display only the current week's data, though a teacher can select any previous week's data by clicking on the Calendar button.
Detailed Data
Below the Class Activity diagrams, teachers can find detailed data on how individual students perform during the week. Once the Placement Test is completed, students are listed here based on the grade level at which they're working. If a student has not completed the Placement Test, an indicator Test Not Started/In Progress will be shown.
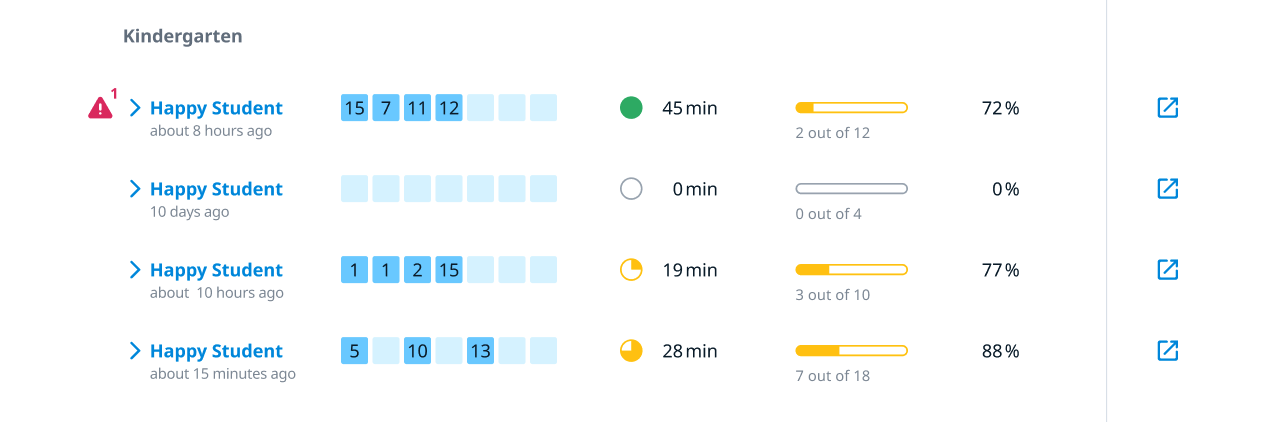
What kind of data can a teacher get from the Weekly Report?
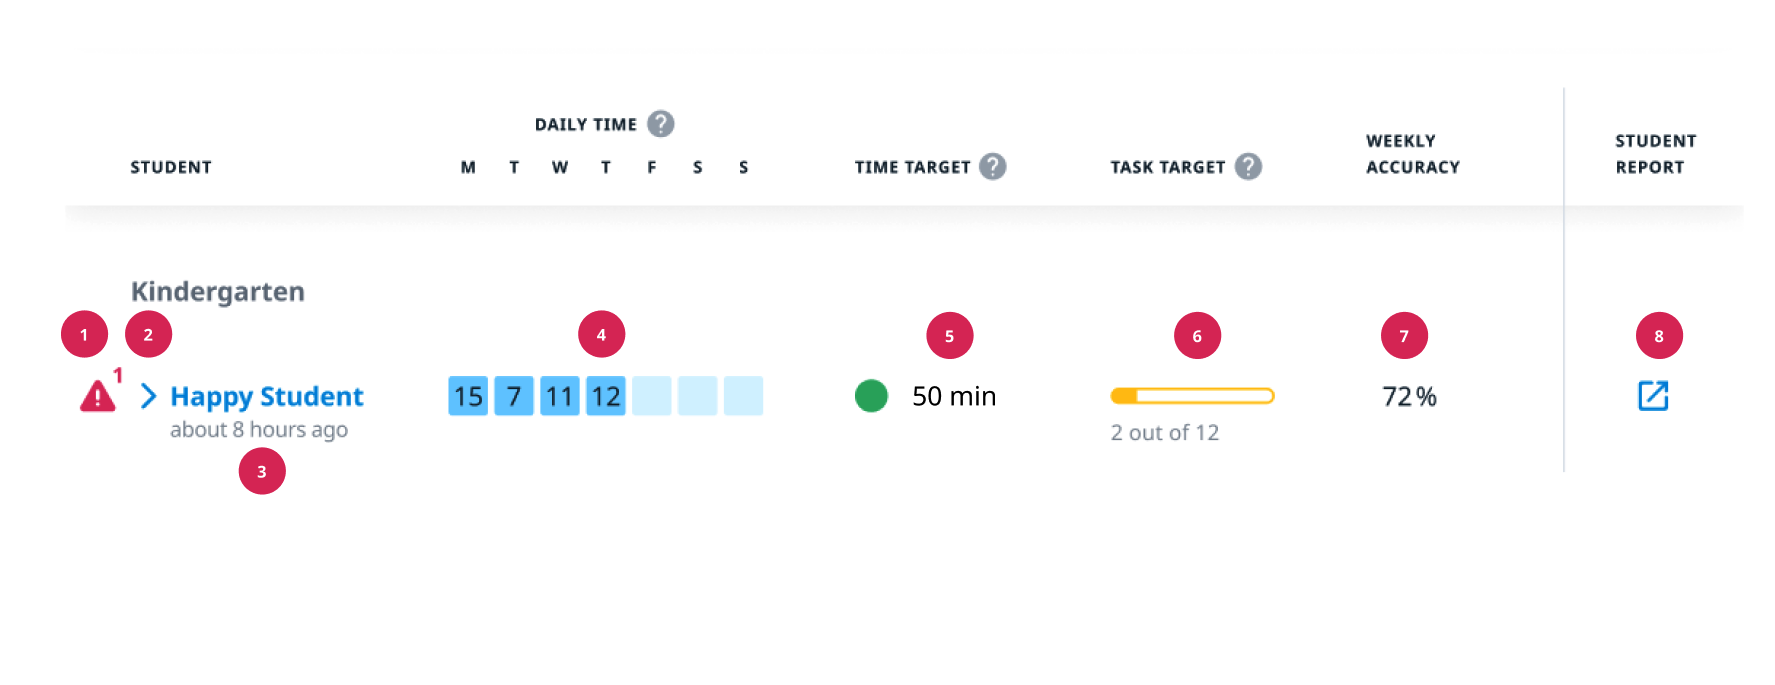
1. This student has had 1 struggle task this week.
2. By clicking the tick, you can see the tasks Happy Student has worked on this week. You can also check the main details on the tasks done during the week selected.
3. They were last online 8 hours ago.
4.. This week, they spent 15 minutes on Monday, 7 minutes on Tuesday, 11 minutes on Wednesday, and 12 minutes on Thursday working on exercises.
5. They have completed their Time Target of 45 minutes, spending 50 minutes in total this week.
6. They have completed 2 out of 12 tasks toward their Task Target.
7. Their accuracy rate on these tasks is 72%.
8. You can view the Student Report for more details on this student's performance.
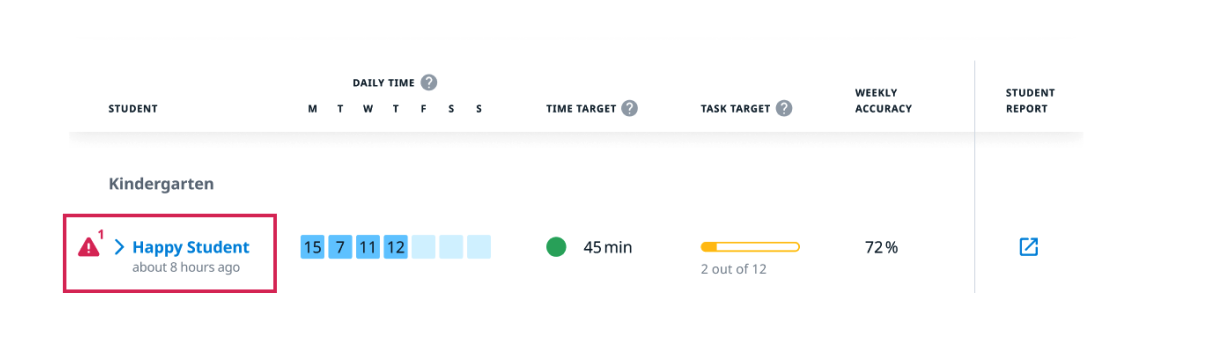
Intervention Alert
Sometimes you notice the red alert mark next to students' names. This alert means that a student has struggled with accuracy in one or more tasks this week.
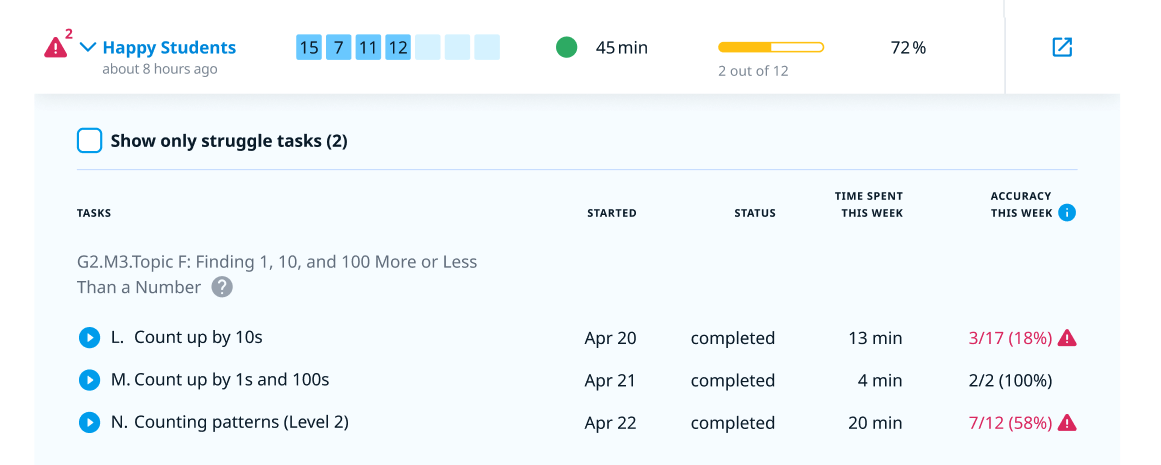
Click the tick icon next to the student’s name to view more detailed information.
This section shows a list of tasks the student has worked on this week, with a red alert symbol next to those they struggled with.
If you want to know more about student intervention alerts, please check out this article.
Note: On average, students should complete their Task Target within the Time Target time. However, all students are different, and some may complete it faster than other students. These indicators for Time Target and Task Target are reset each week so that students begin each Monday morning with the clock and progress bar at zero.
The indicators turn green when the targets are achieved, so we recommend teachers encourage their students to try turning the clock and Progress bar green each week.
Access to the Weekly Dashboard is limited if you have a Basic Classroom license. To learn more about the differences between license types and what features are available, please visit this page.