District Assessment Report
Student test results are a valuable tool for gathering and monitoring detailed data on student performance. These assessment results provide schools and teachers with the opportunity to refine their teaching methods and evaluate the effectiveness of their instructional approaches. Recognizing this value, we've introduced a new Assessment report to Happy Numbers.
For more information on assessment reports, contact your Customer Success Manager or email cs@happynumbers.com.
What is the District Assessment Report?
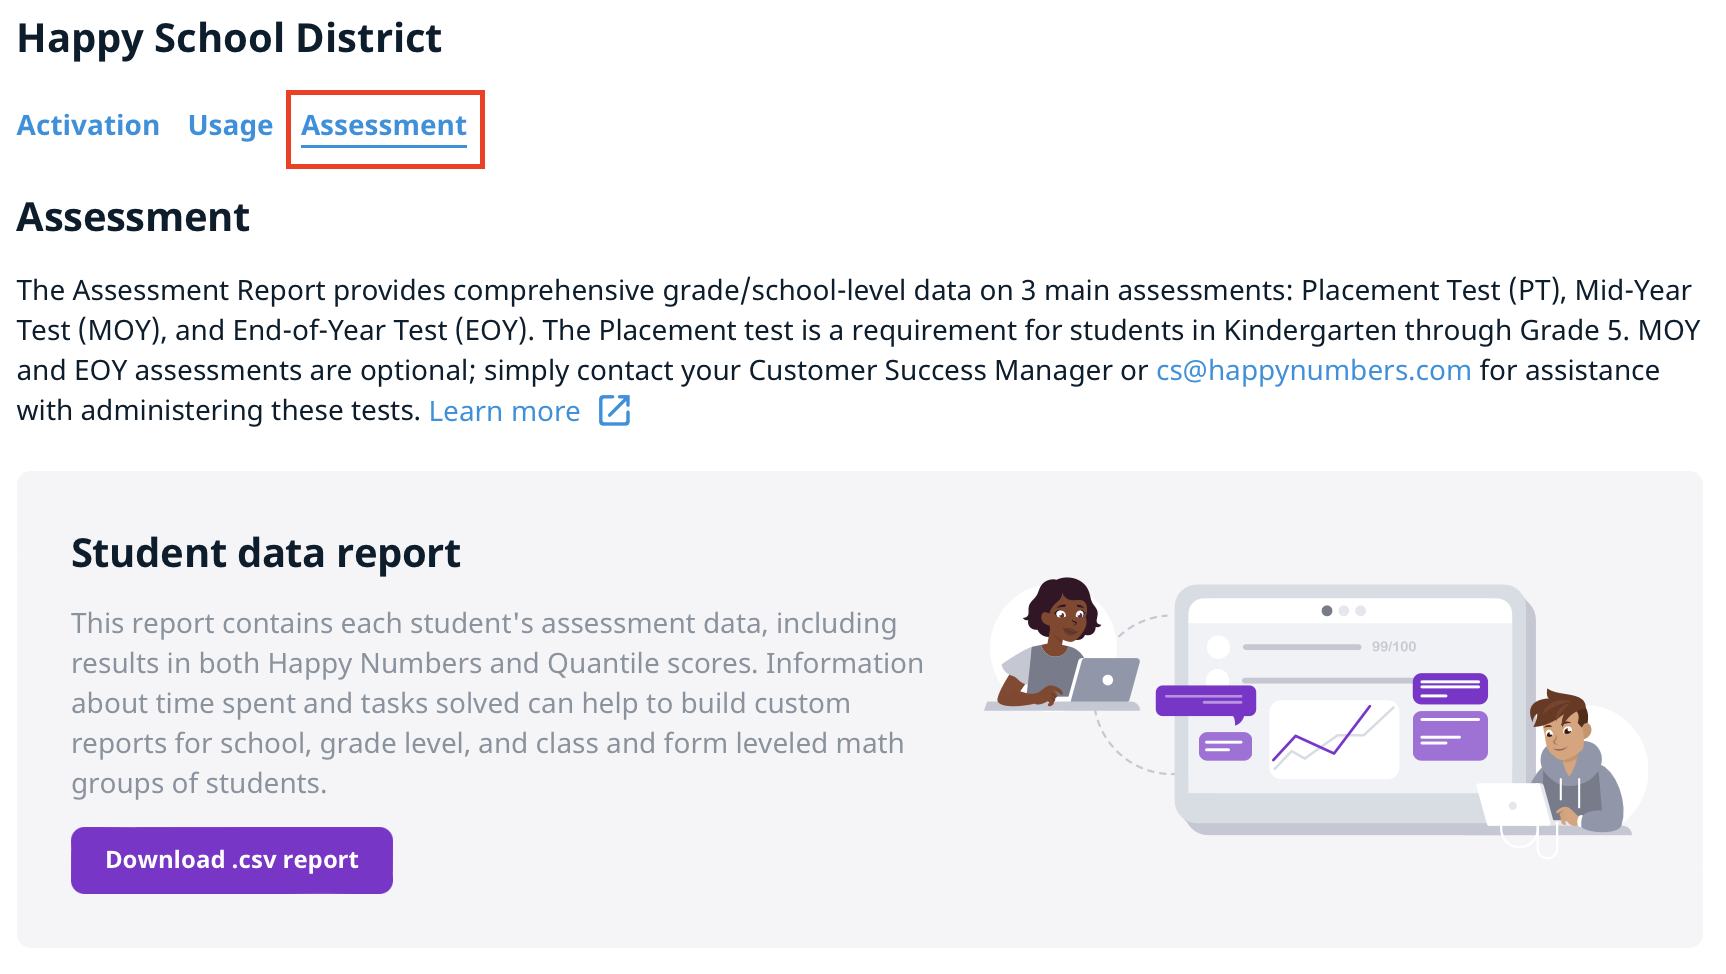
This report allows you to track the details of three main student assessments: the Placement Test, Mid-Year Test, and End-of-Year Test. You can find it in the Assessment section of your district administrator account. Within this section, you can:
-
Download a Student Data Report (.csv) containing detailed information for each student.
-
Access reports with assessment results.
-
Download individual PDF reports for each assessment.
Student Data Report
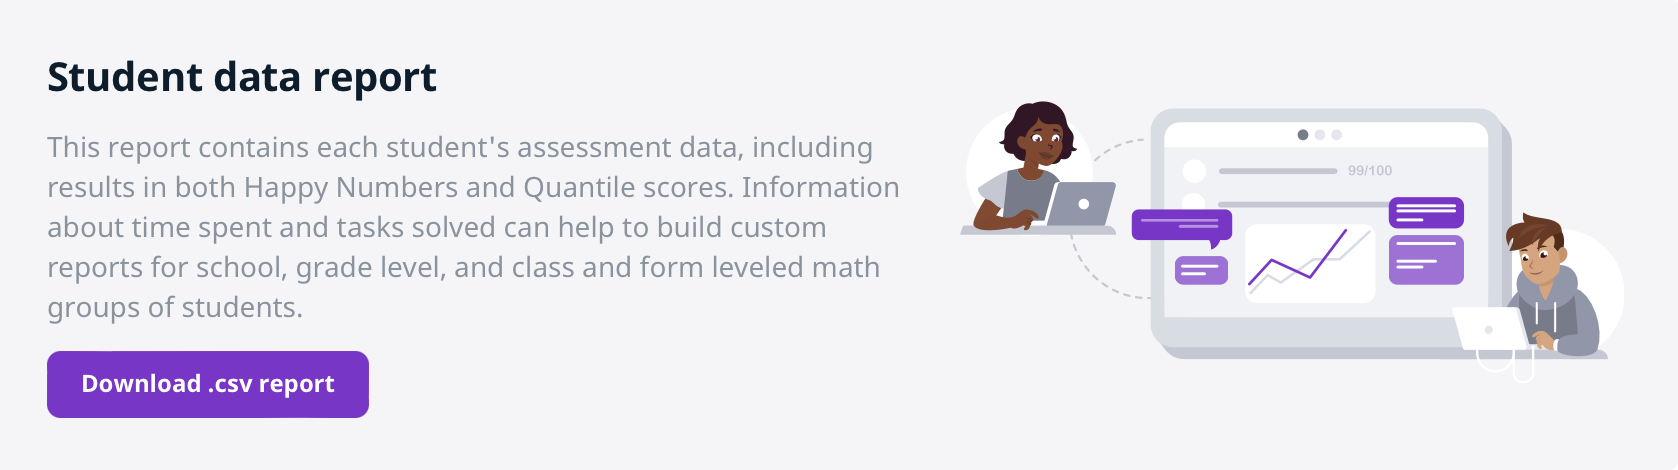
To view information about each student rostered, click on the Download .csv report button. The CSV file entails the following details:
-
Student name
-
Teacher’s email
-
Class number
-
Grade
-
Placement Test Score
-
Initial placement in the curriculum based on PT result
-
Mid-of-Year Growth (comparison between PT and MOY results)
-
MOY Test Score
-
Placement based on MOY result
-
MOY grade readiness
-
End-of-Year Growth (comparison between PT and EOY results)
-
EOY Test Score
-
Next grade readiness
-
Tasks completed
-
Total time spent
Our data calculation process starts automatically, but it may take some time for the download to complete. The report will also be sent to the email address associated with your Happy Numbers account.
If you encounter any errors while downloading the report, please reach out to our support team at support@happynumbers.com or via live chat.
Assessment Report
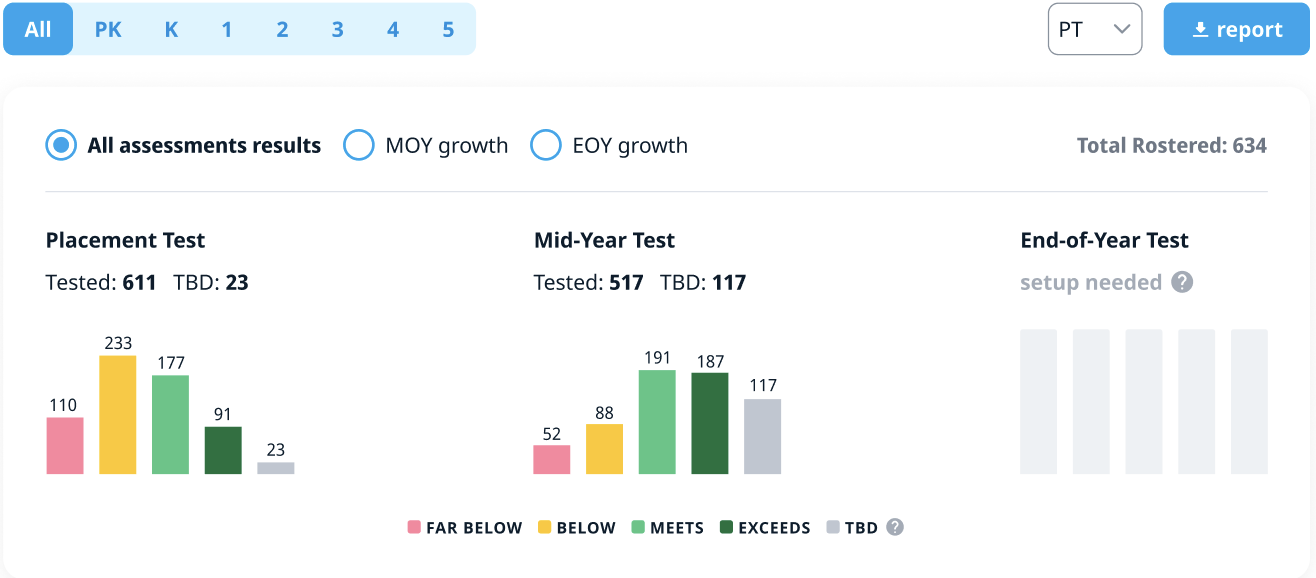
At the core of the new functionality is the option to view various chart types. You can now choose between three visualization options:
-
All Assessments Results: This is the default option, showing an overall picture of student performance at three key points in the academic year: the beginning (PT), middle (MOY), and end (EOY). Each point is represented by a bar chart displaying the results independently.
-
MOY growth: This option enables analysis of changes in student performance by the middle of the academic year. Here, you can see two horizontal bar charts displaying the number of students who passed both Mid-Year and the Placement Test.
-
EOY growth: This option allows analysis of changes in student performance by the end of the academic year. Similar to the previous option, you can see two horizontal bar charts displaying the number of students who passed both End-of-Year and the Placement Test.
Show By School
The section below provides admins with detailed data on how the assessment results are distributed in each individual school.
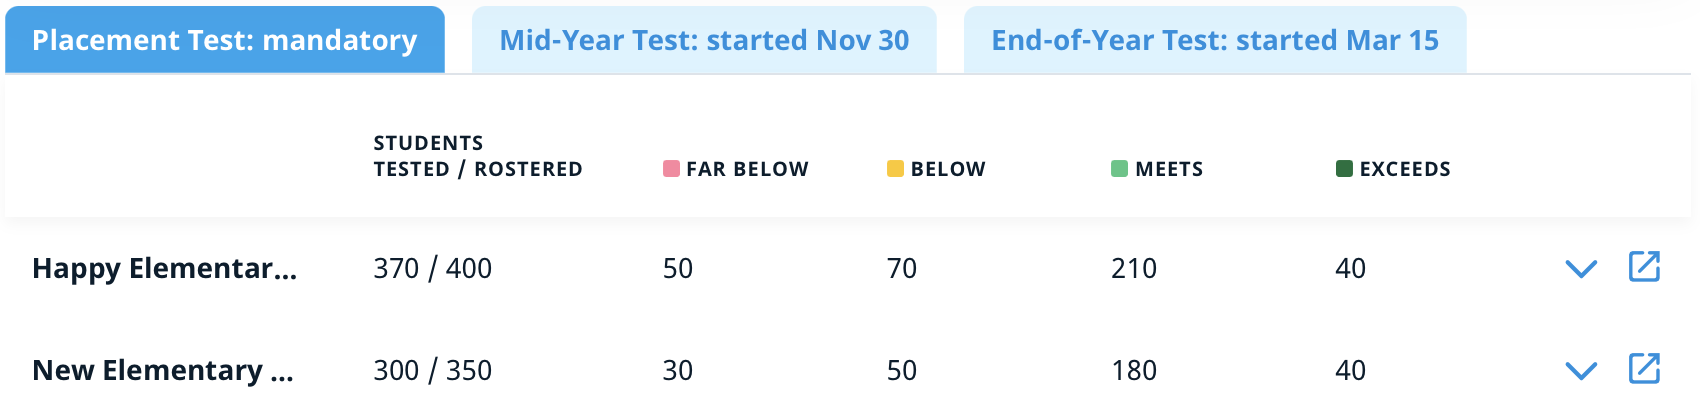
Here you can also switch between assessments and see their dates.
For information on setting up a district- or school-wide assessment window, please contact your Customer Success Manager or cs@happynumbers.com.
Show By Grade
By changing the filter above to Show By Grade Level, you will see district-wide assessment results grouped by grade level. The structure of this section is the same as Show By School.
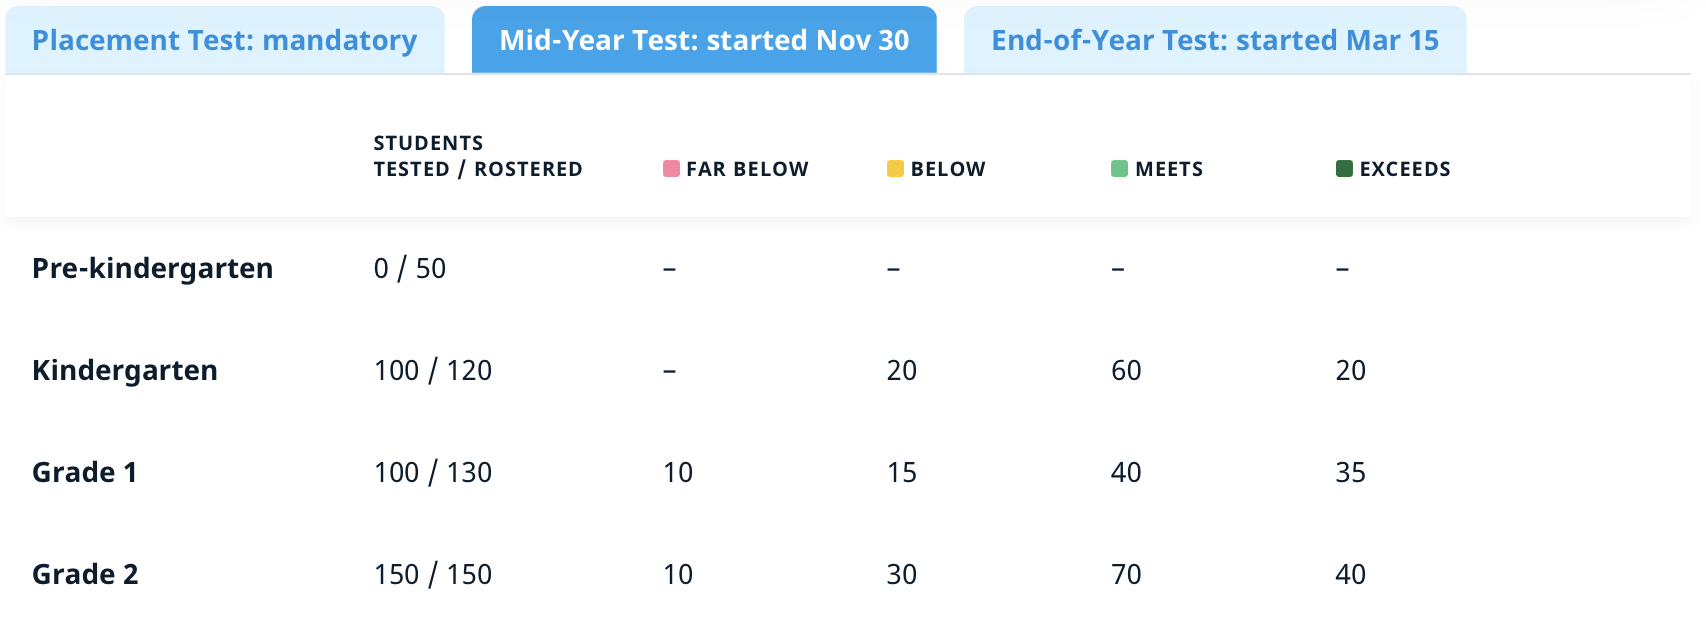
We recommend monitoring the “Students Tested” metric to make sure the maximum number of students are tested. If there are many students who scored below grade level, it will be worth paying attention to HappyNumbers usage in these classes. To know more about the District Assessment Report or to request help, please get in touch with us at cs@happynumbers.com or via live chat.
The District Assessment Report is available only with the District license. Support from a dedicated Customer Success Manager is available with both School and District licenses. To learn more about the differences between license types and what features are available, please visit this page.