Skills Report
What is this report about?
The Skills Report shows the current progress of your students on particular math skills and flags those who need help. The more time students spend on Happy Numbers, the more accurate the report is.

Skill Levels
Each particular skill will be assessed for each student at one of three levels. To assess a student’s skill level, we look at the last 20 attempts to solve problems on that skill and measure the accuracy.

Those skills that the student has successfully Mastered or is mastering at the moment are highlighted in green. This level starts at 80% of accuracy.
Highlighted in yellow are Developing skills, in which there is progress, but full mastery has not yet occurred. This level starts at 60% accuracy.
The red highlighting is perhaps the most important, as it represents Help Needed for that student with that skill. We recommend that you pay attention to such skills and provide additional intervention for those students.
You may also see gray squares. This means that Happy Numbers doesn’t have enough information to assess the skill. Please don’t worry; as soon as the student solves the right amount of tasks for the skill, you will see the updated information in the report.
Domains
All skills are divided into domains - sets of skills that are meaningfully related to each other. At the top of the report, choose the domain you want to evaluate. You will see only domains which are relevant to your students.
Here is the complete list of our domains:
-
Numeracy
-
Addition
-
Subtraction
-
Multiplication
-
Division
-
Fractions (non-decimal)
-
Geometry
-
Measurements and Data
-
Time and Money
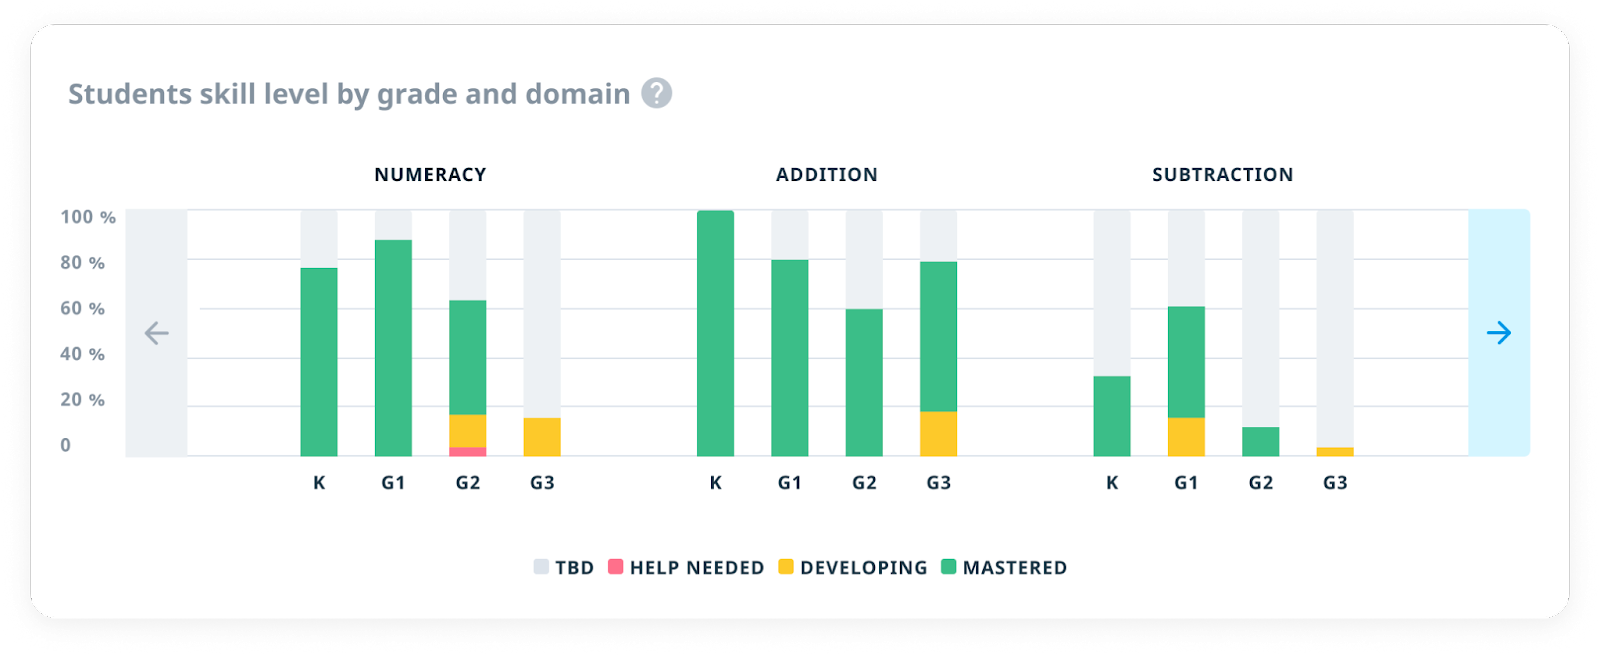
Diagram Section
At the top of the report you can see the whole status of your class at a glance.
For K-5 teachers, the diagram block looks like this:
And for Pre-K teachers, like this:
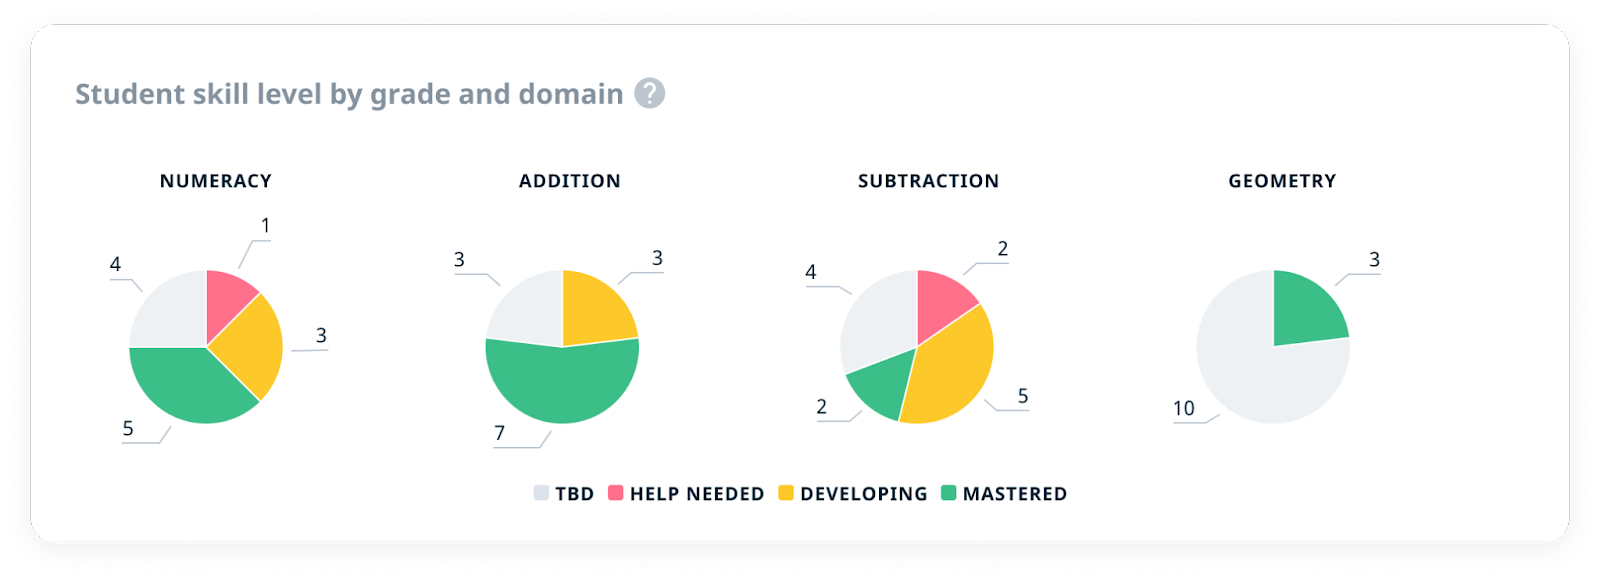
All the information is grouped by domains, and each domain is split into grade levels. You can see the skill level distribution within each grade level for each domain.
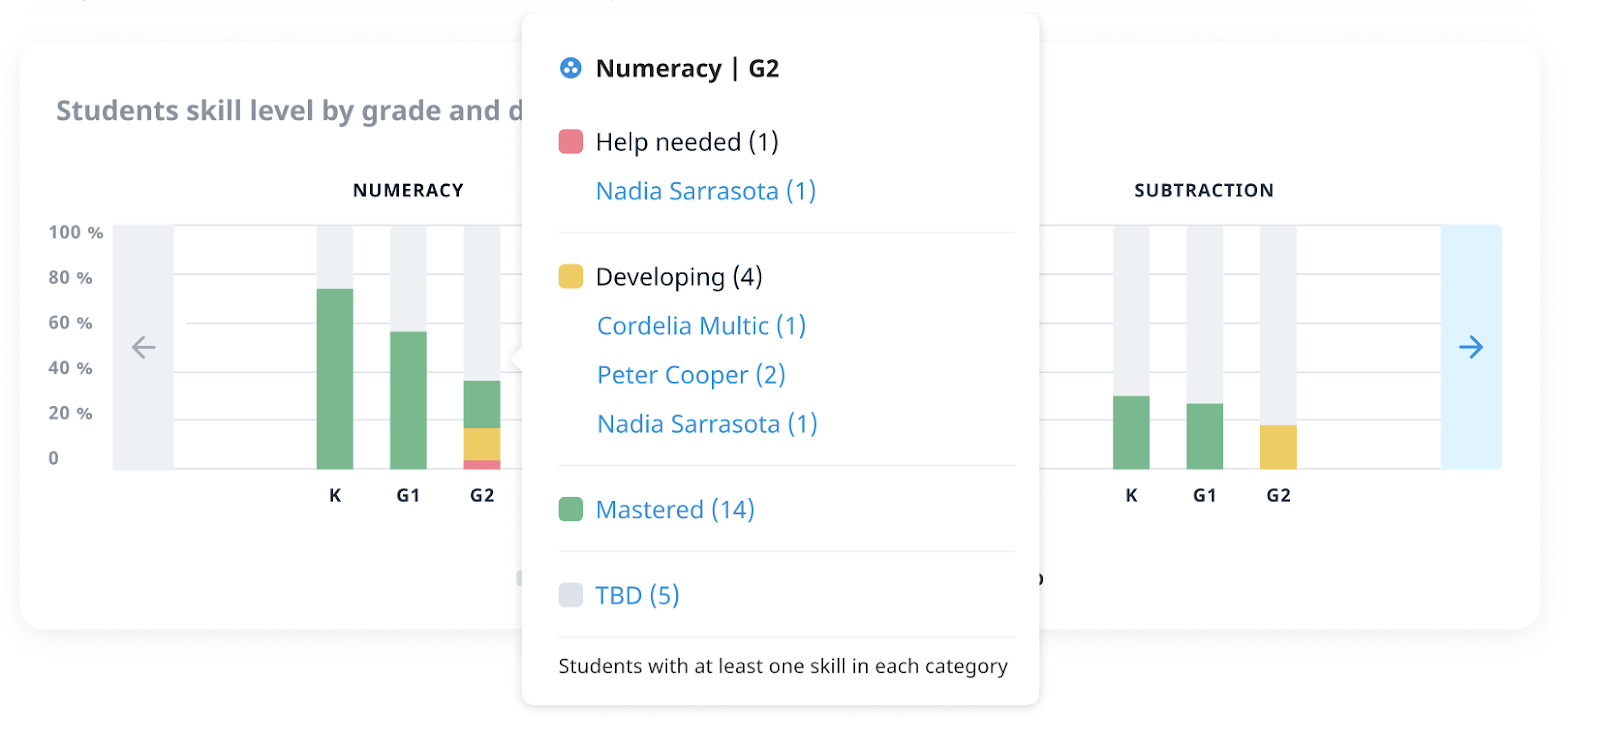
By hovering over the bars/circles, you will see detailed information.
To see more domains, just click on the arrows on the right or left side of the Diagram Section.
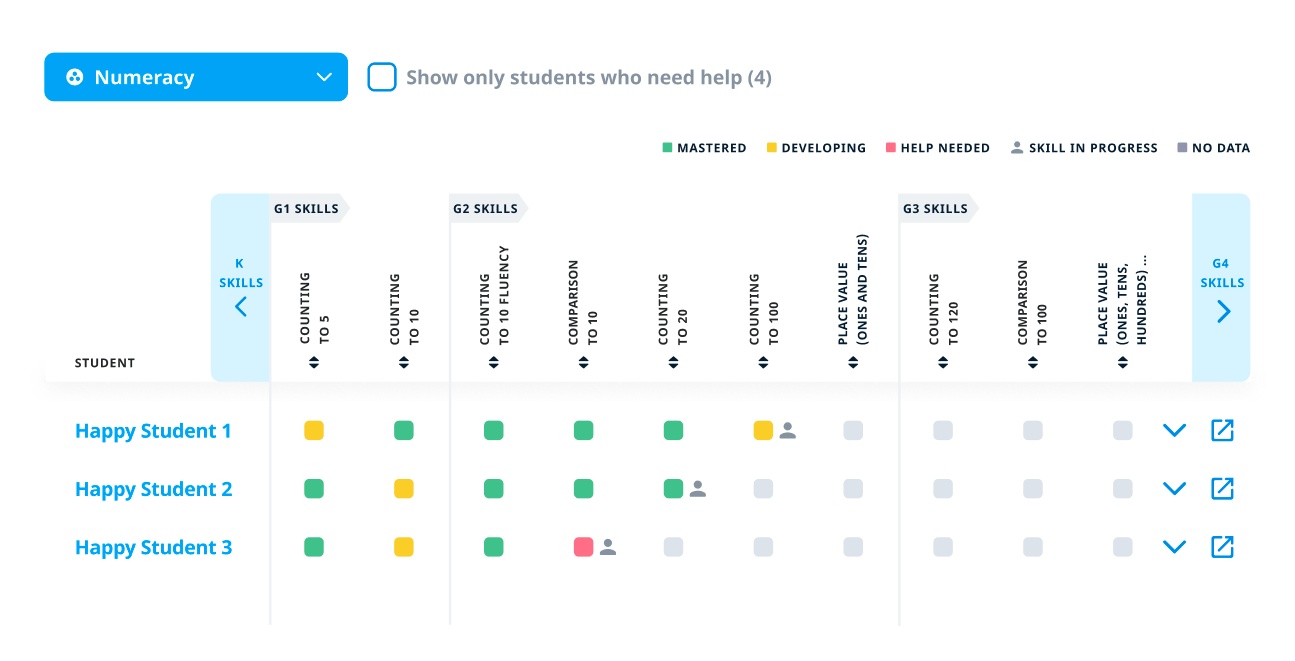
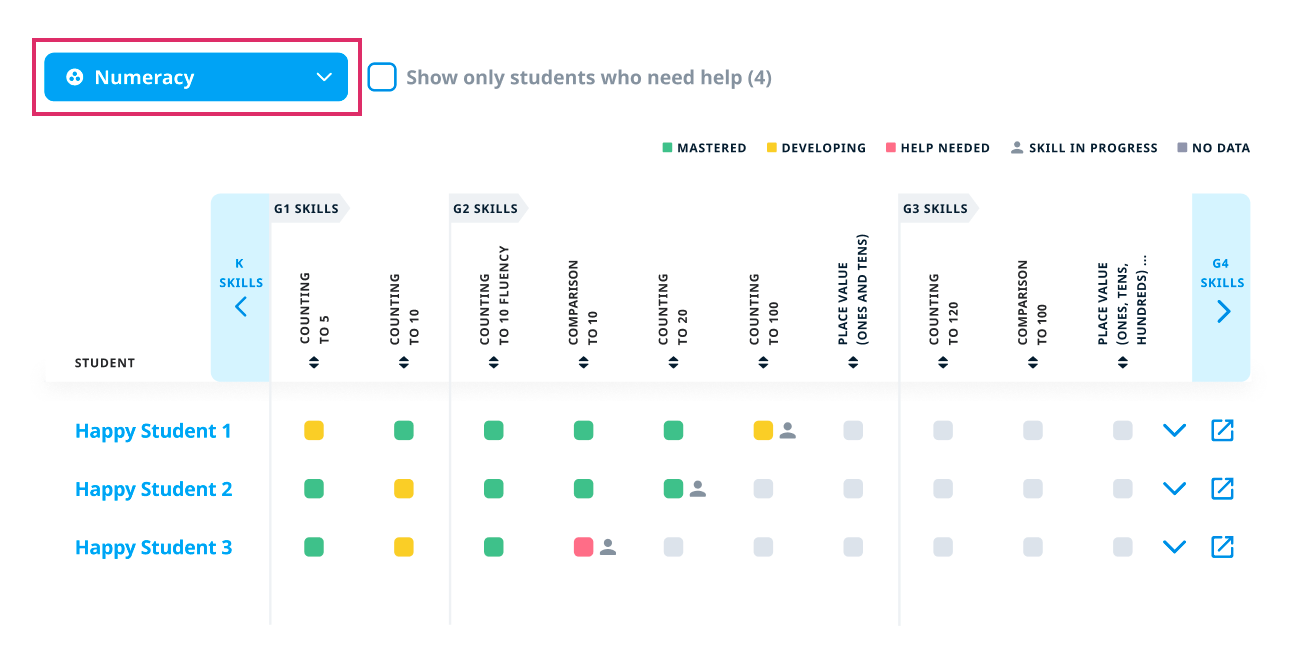
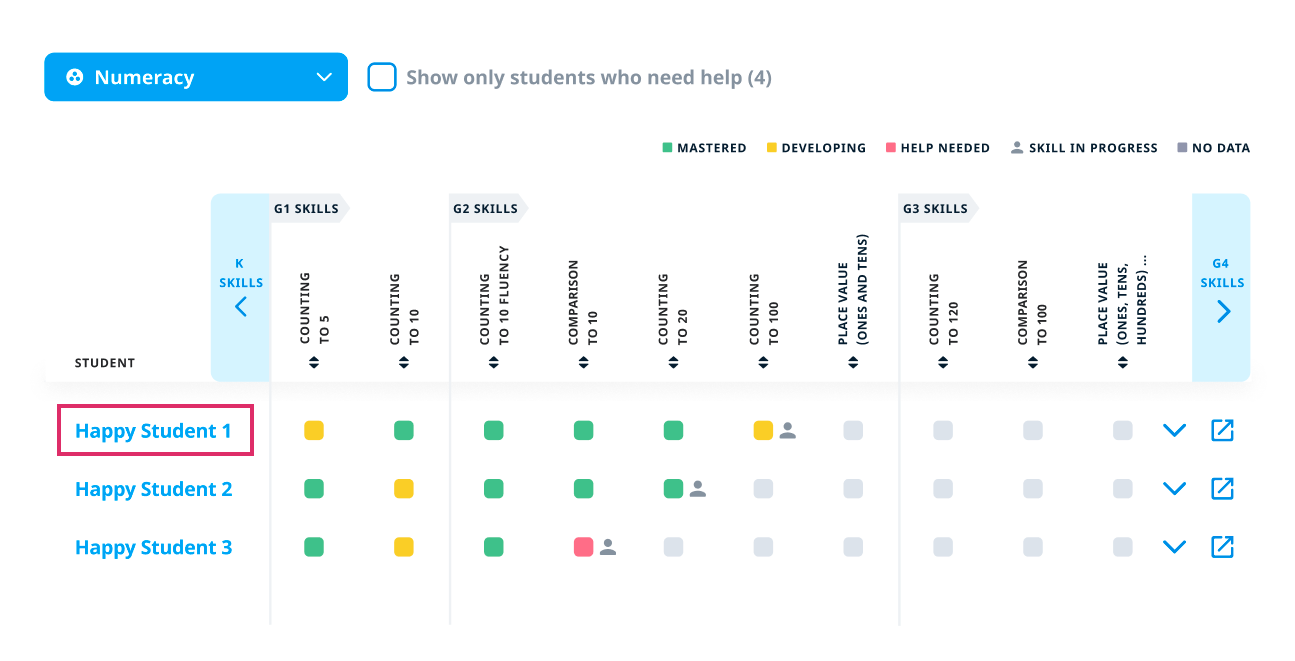
The Main Report
Below the diagram section, you can find the main table with student names in rows and skills in columns. The table provides information only within one domain. To change the domain, click on the blue button at the top.
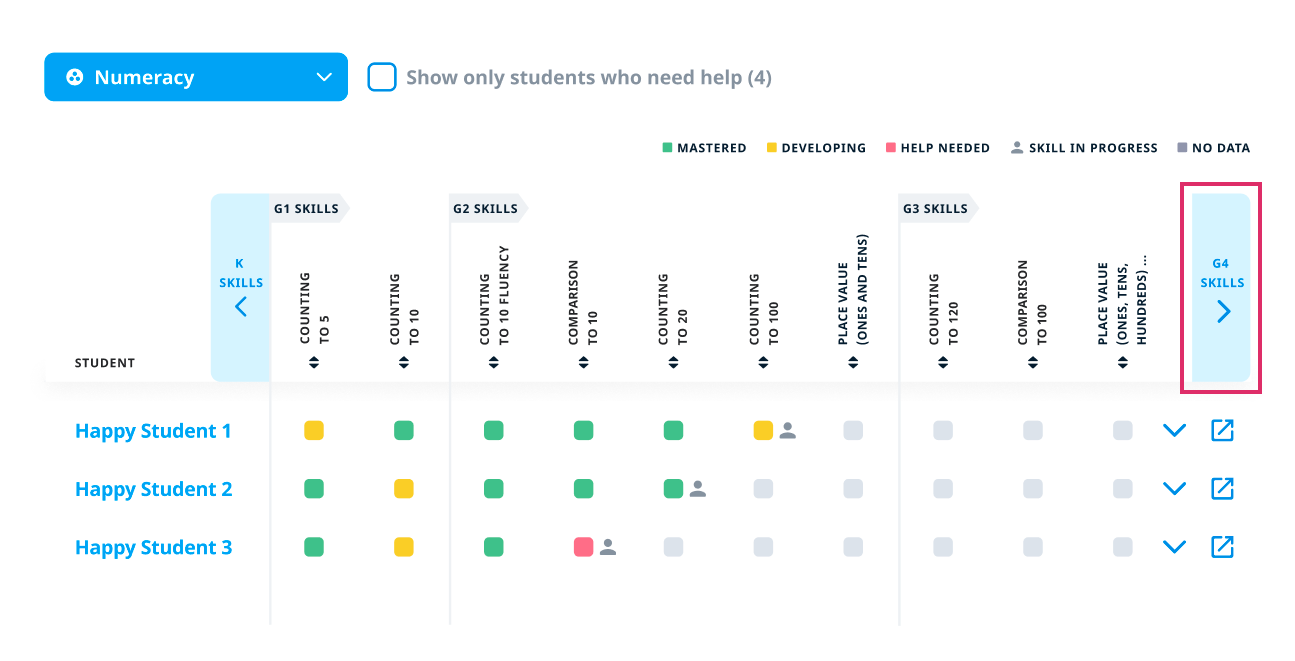
The Slider
The slider on the right allows you to view the skills within the selected domain, divided by grade level. Note that we can often assess student skills in a grade above or below the one the students are actually in.
Outdated Information
If a student does not spend enough time in HappyNumbers, it becomes difficult for us to objectively assess their skills. Such a situation is indicated by a gray clock that draws your attention to students who spend very little time using Happy Numbers.

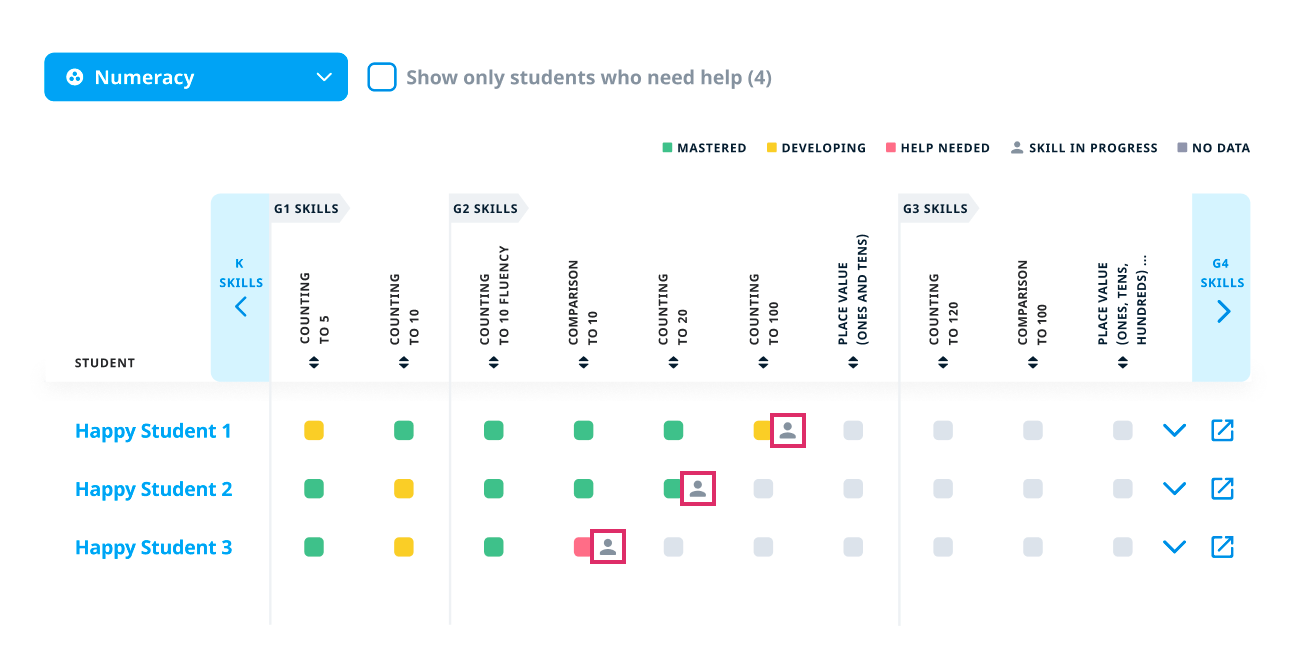
In Progress
The In Progress badge marks those skills for which the student is still solving problems. This means that the yellow (and sometimes even red) levels may not be cause for alarm - the student is still working through these tasks, perhaps at the beginning of the journey, and just needs time to master this skill.
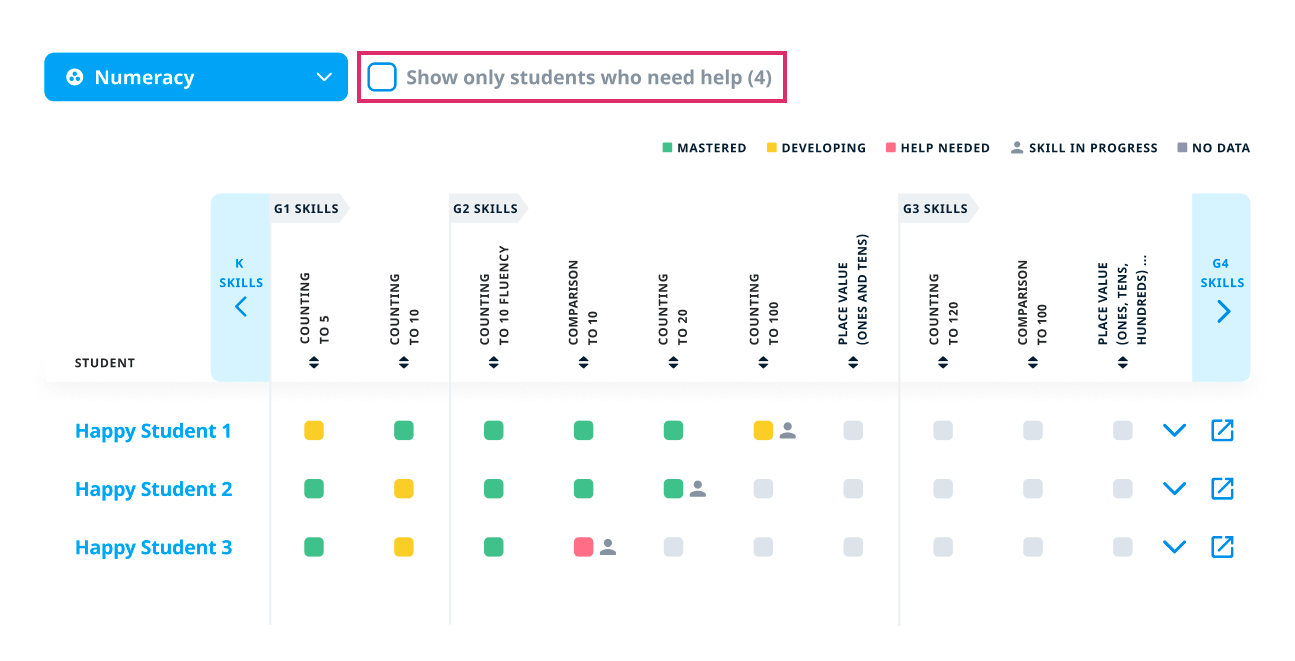
Need Help
The Need Help filter allows you to show only those students who need your help.
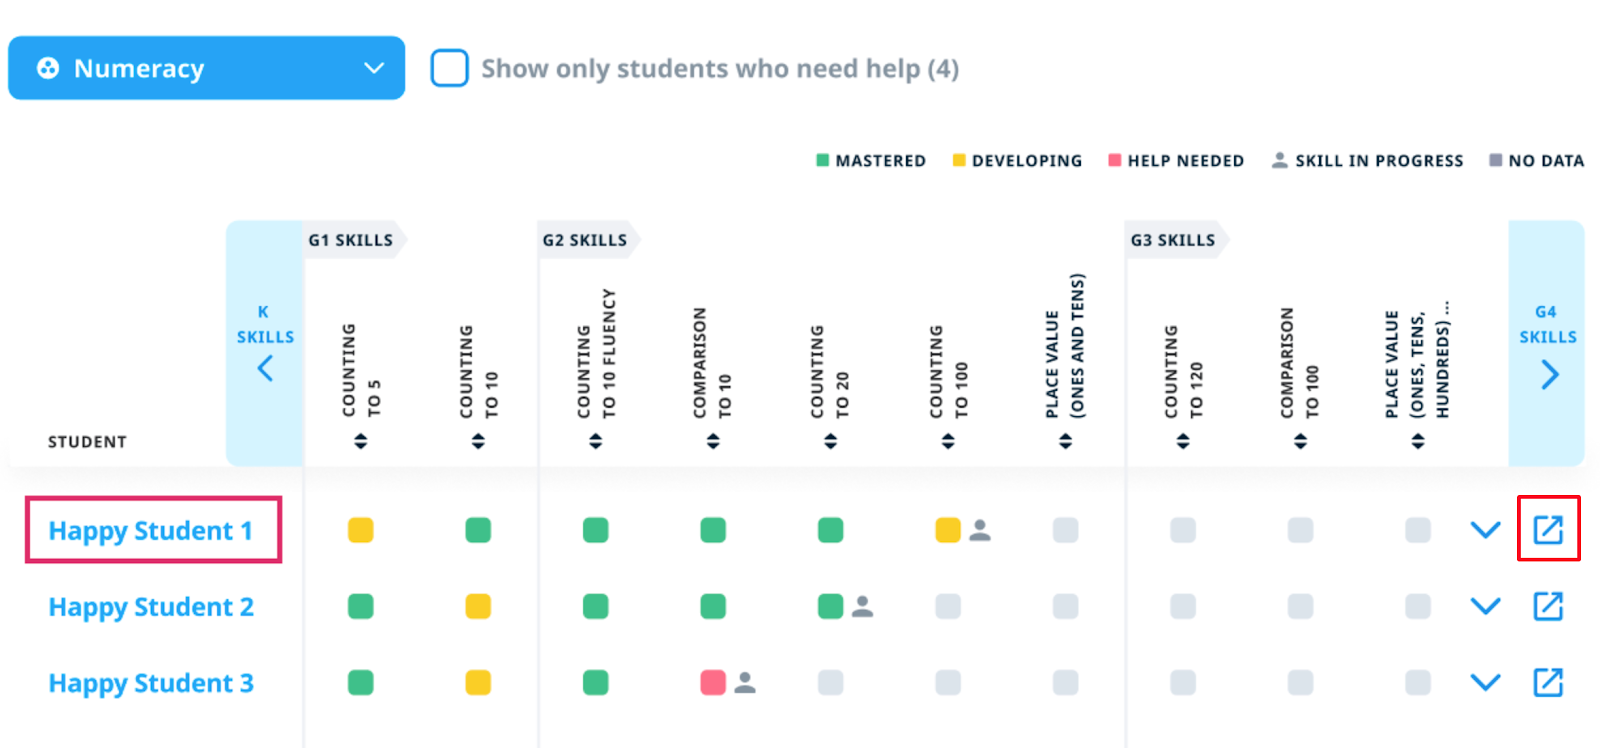
Student Details
Click on a student’s name or on the arrow to the right to view a more detailed report for a particular student.
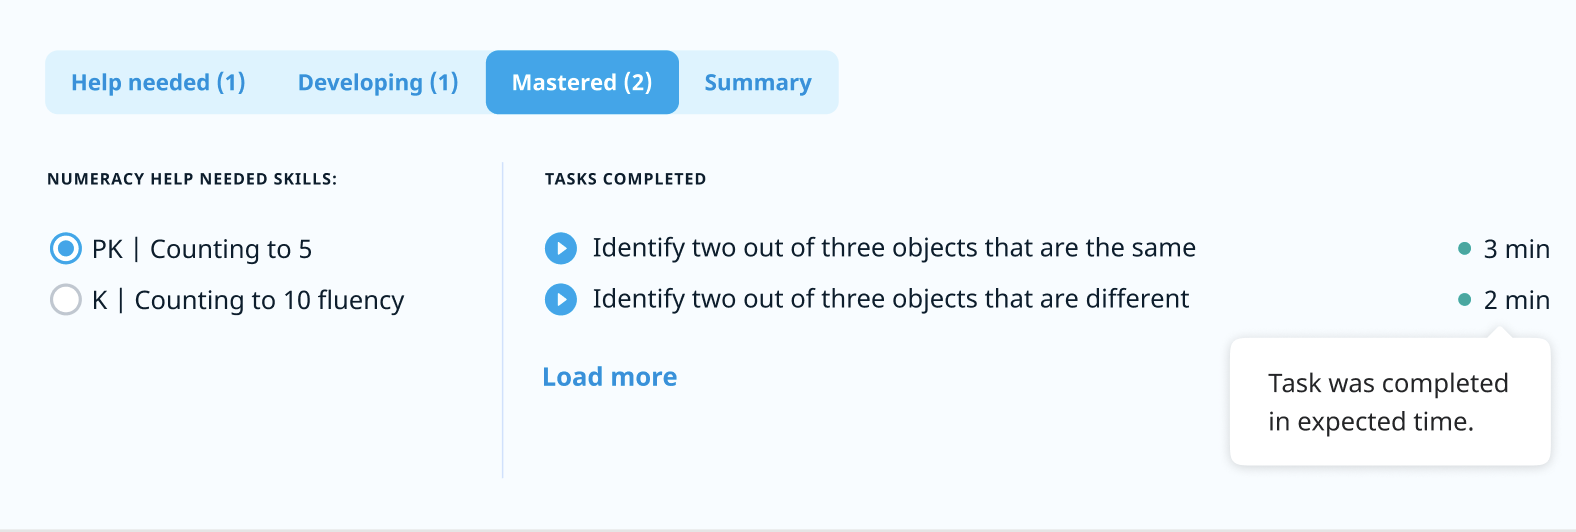
Here you can see all of that student’s skill assessments, whether Mastered, Developing or Need Help, as well as a Summary of progress.
For each skill, we provide information about accuracy.
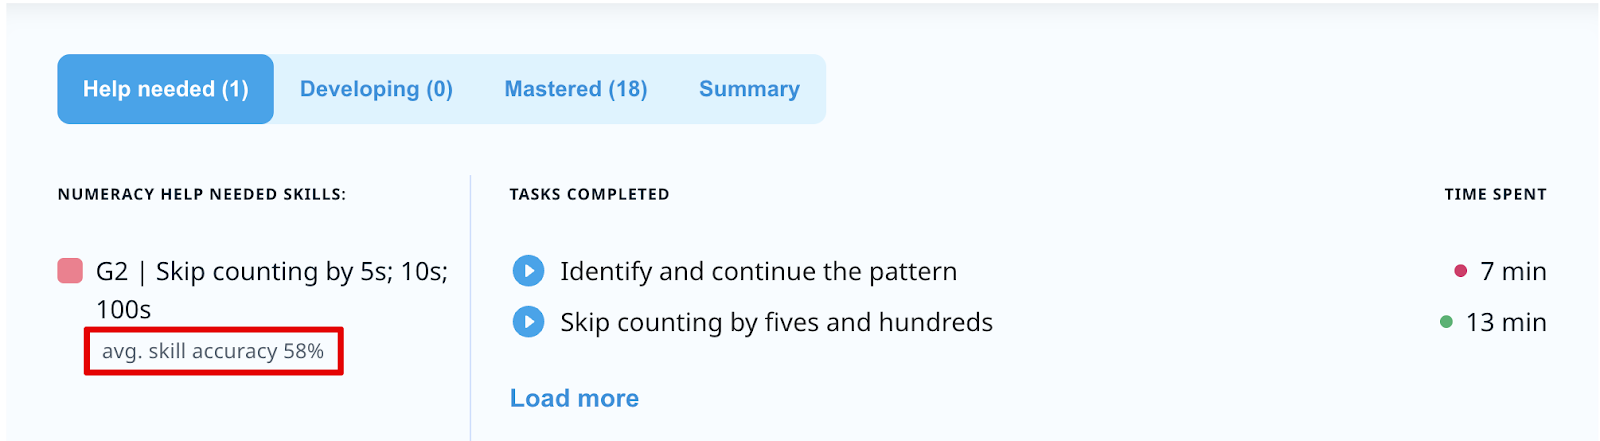
On the right side, you will see the list of tasks that student solved. They are sorted from the last one (most recent) to the first one. All task names are clickable, so you can see the whole exercise in which your student may struggle. Note that if you hover over the time spent on a task time, you’ll see a comparison of the time taken to our estimates.
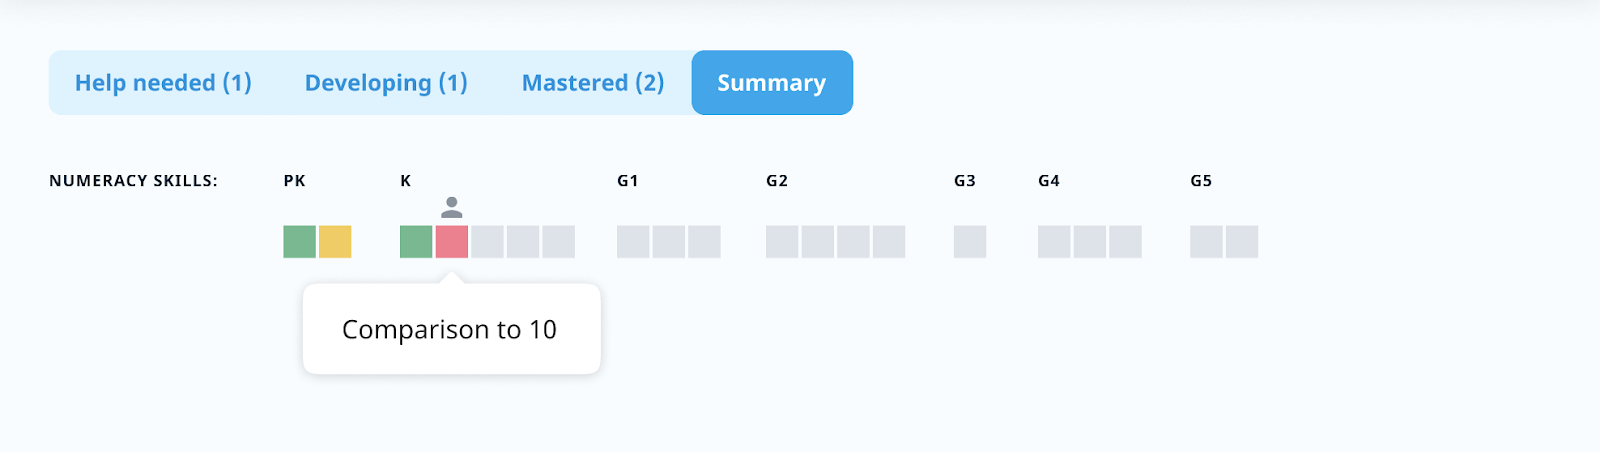
The Summary shows the overall progress of this particular student through the course.
You can proceed to an individual student report by clicking the button next to the 'Open details' arrow as shown below.
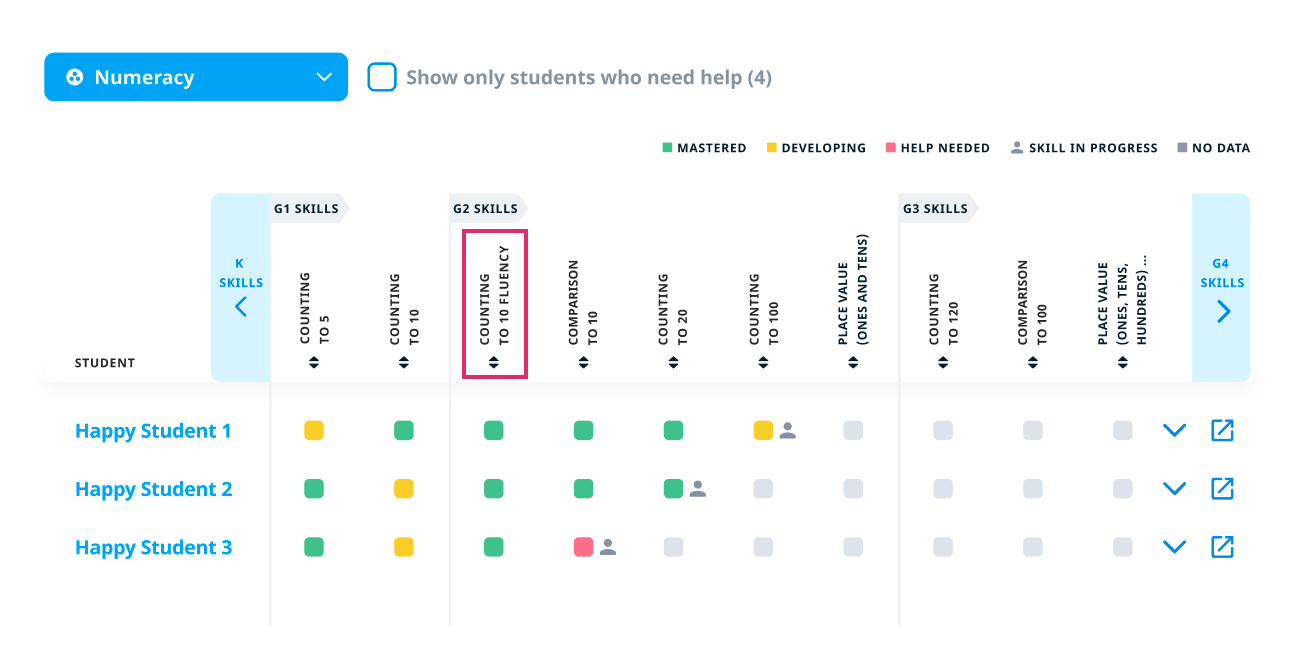
Sort by Skill
Sometimes - for example, when forming small groups - it is useful to understand which students are successfully mastering a skill, and which are having more difficulty. To sort the list of students by a specific skill, click on the skill on the slider.
Is the skills report data accurate?
Yes, it is. At times, students try to click through a problem when they don’t know how to solve it, or they’re just not in the mood to try. That’s why we’ve come up with an advanced skills-tracking mechanism that counts no fewer than 4 problems of different types and no more than 5 attempts to solve each of these problems. Thus, if a student tries to click through a problem many times, our program will recognize this activity and will not display such attempts.
Should you need help interpreting your Skills Report, send us a message on live chat or at support@happynumbers.com.
Continuous Skills Assessment (which powers the Skills Report) is not available with the Basic Classroom license, and access to the Individual Student Report is limited. To learn more about the differences between license types and what features are available, please visit this page.