Where can I find my class reports?
Happy Numbers lets teachers analyze class and individual student progress through a set of reports. Reports represent student progress across the board, so teachers can use them to adjust assignments, make instructional decisions (such as forming needs-based groups), and share with parents or colleagues.
To access the Reports tab, first click on the ‘Reports’ button on your teacher dashboard. This tab consists of seven sections: Weekly Dashboard, Skills, Yearly Dashboard, Assessment, Progress Report, Activity Stream, and Parent Report.
Weekly Dashboard
This dashboard lets a teacher check on how individual students or a whole class perform during the week. It consists of two main parts: an upper diagram section with a class activity summary, and a lower diagram displaying individual student details.
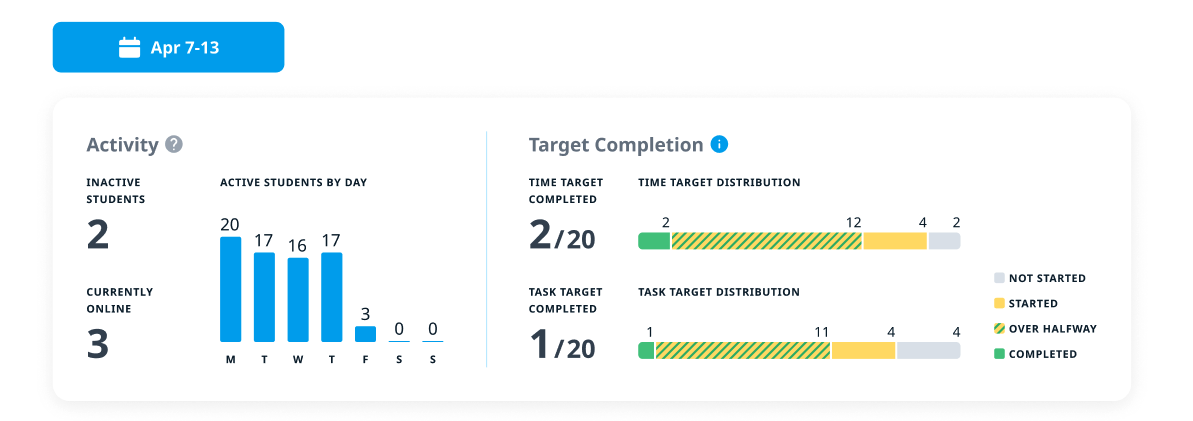
The Activity section lets a teacher see how many students stayed active (logged in) during the week and on which days.
The Target Completion section lets teachers check the achievement of Time and Task Targets. The data indicates the total number of students who completed the weekly Time Target. By default, the Weekly Time Target is set to 30 minutes for Pre-K, 35 minutes for Kindergarten, and 45 minutes for Grades 1 and above. The Task Target is the minimum number of tasks per week that students are expected to complete. It is calculated based on a student’s assignment and Time Target.
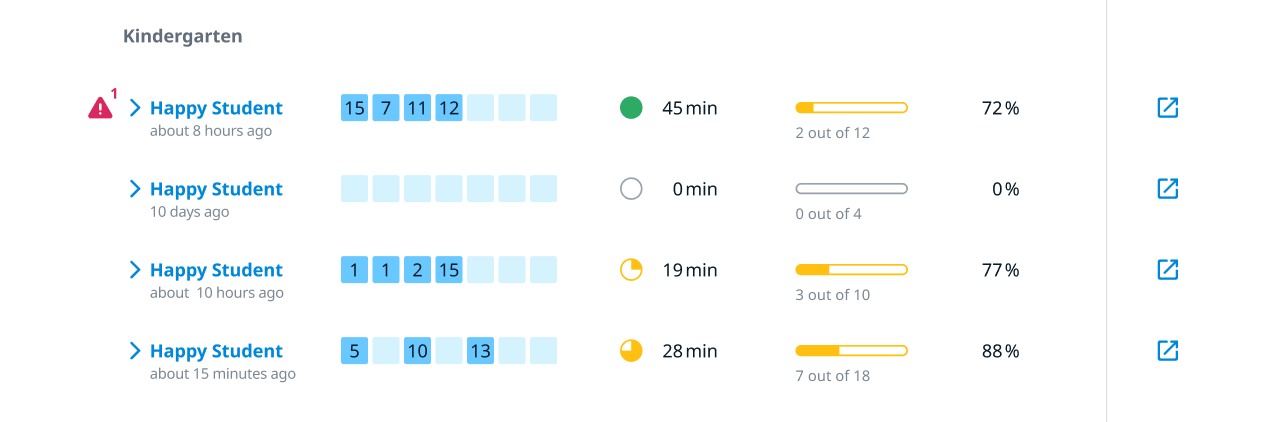
Below the class Activity diagrams, teachers can find detailed data on how individual students perform during the week. The indicators for Time and Task Targets turn green when the targets are achieved, so we recommend teachers encourage their students to try turning the clock and progress bar green each week.
Learn more about the Weekly Dashboard here.
Student Skills Report
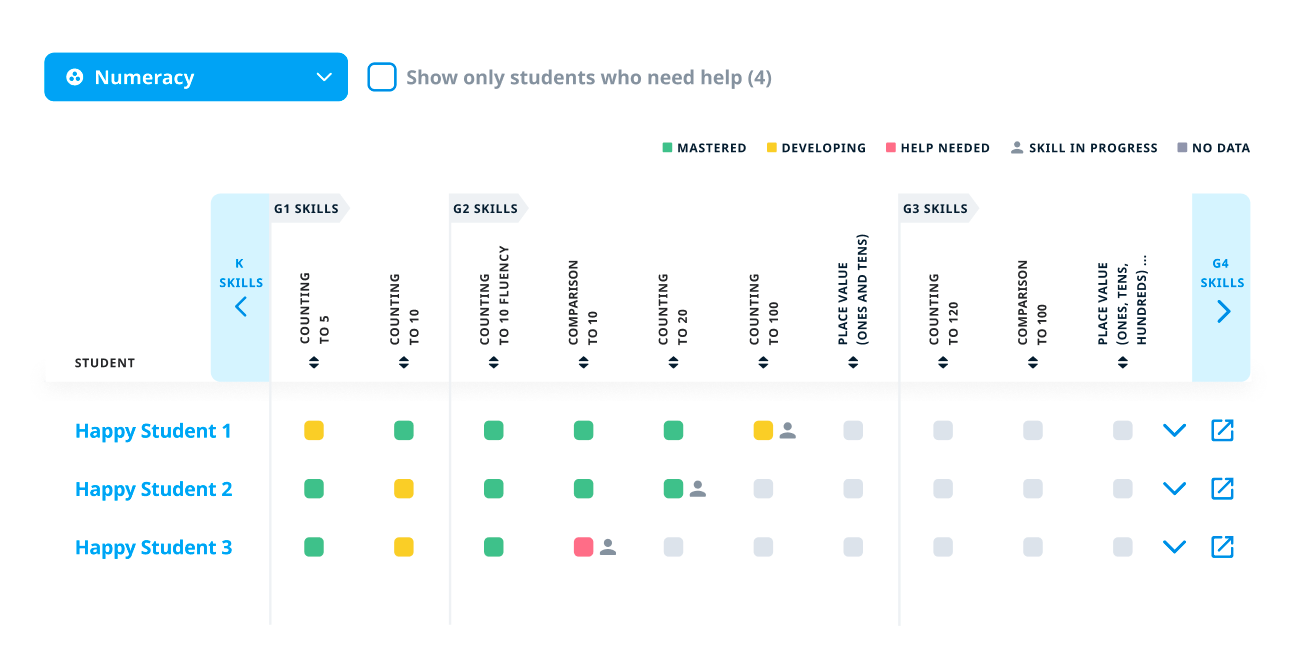
The Skills Report shows the current progress of your students on particular math skills and flags those who need help. The more time students spend on Happy Numbers, the more accurate the report is.
Learn more about the Student Skills Report here.
Yearly Dashboard
The Yearly Success Report has been developed for teachers to better understand how their class performs on a yearly basis. The report consists of four main sections: Class Distribution, Overall Progress, Next Grade Readiness, and Student Progress Tab.
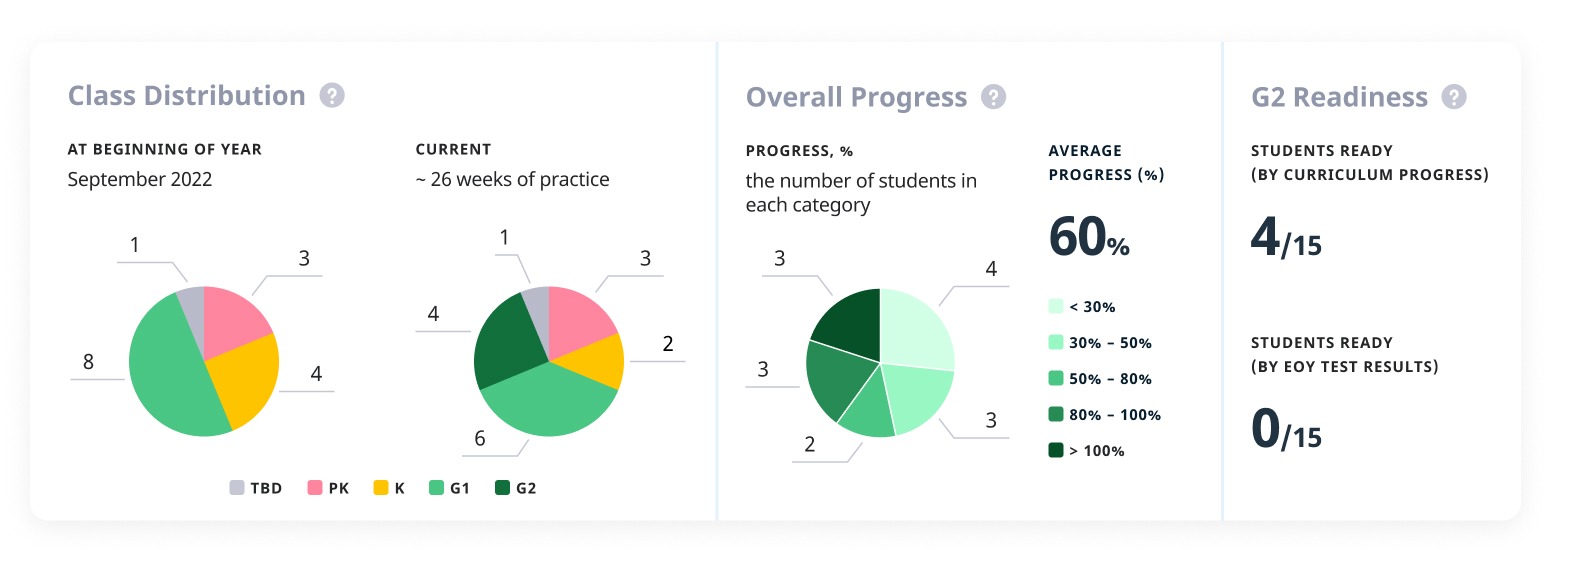
Class Distribution
These diagrams display data on class distribution at the beginning of the year according to Placement Test results and the current week according to pace and performance.
Overall Progress
This section represents the data on the progress made through the Happy Numbers curriculum by the entire class. It shows average progress as a percentage of the curriculum and the number of students ready for the next grade. The pie chart breaks the class down into groups based on percentage progress.
Next Grade Readiness
This section shows the number of students ready for the next grade based on the curriculum progress made and End-of-Year Test results. For example, your students might be not advancing too much within the curriculum, though they might be ready for the next grade based on the test results, and vice versa.
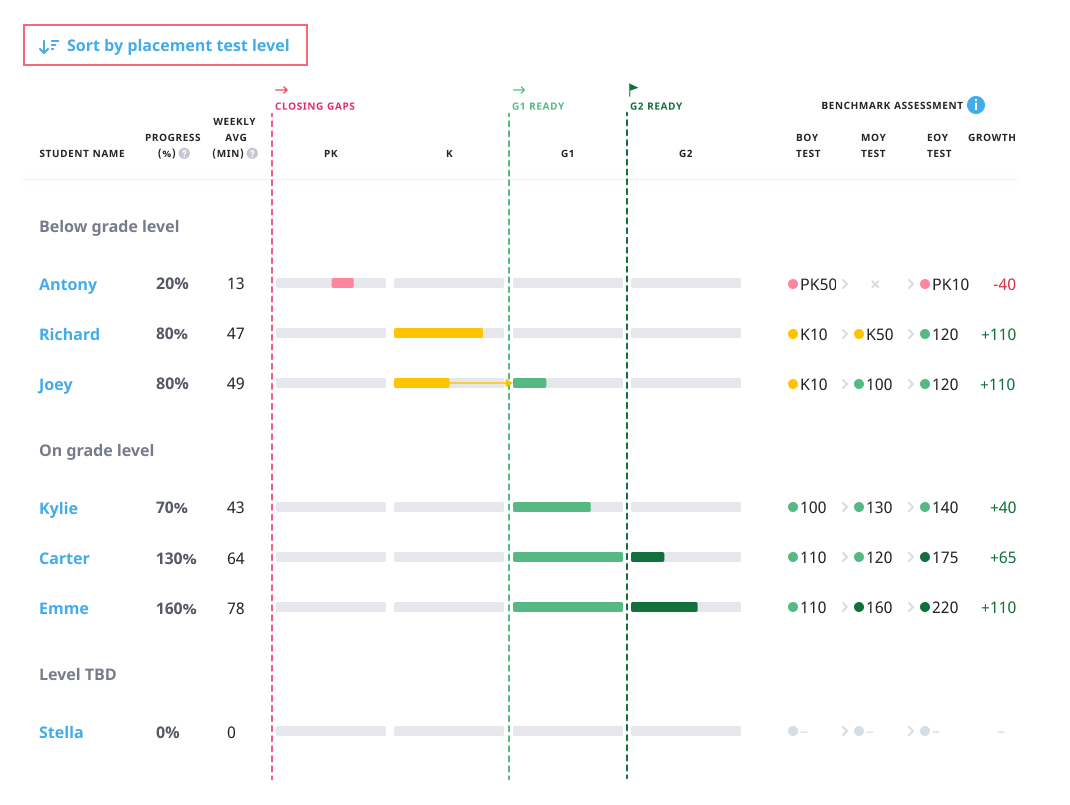
Student Progress Data Tab
This section displays student progress data about each student: The progress a student made since the curriculum starting point as a percentage, average time spent weekly, curriculum progress bar with covered sections shaded, all test results, and math growth based on those results.
Learn more about your Yearly Dashboard here.
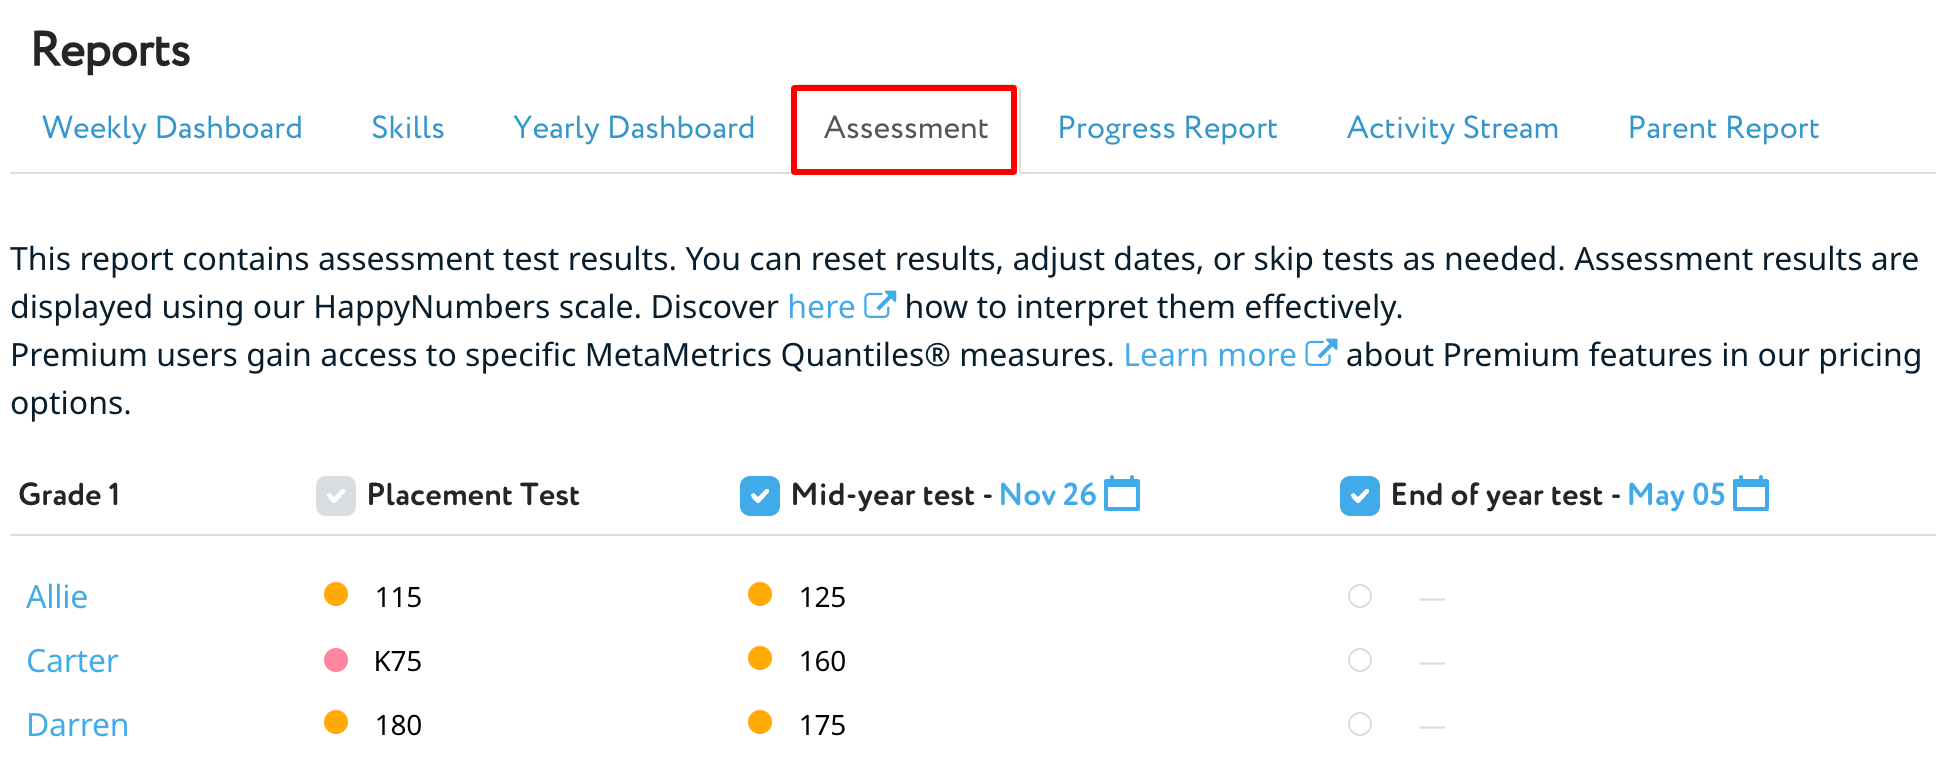
Assessment Report
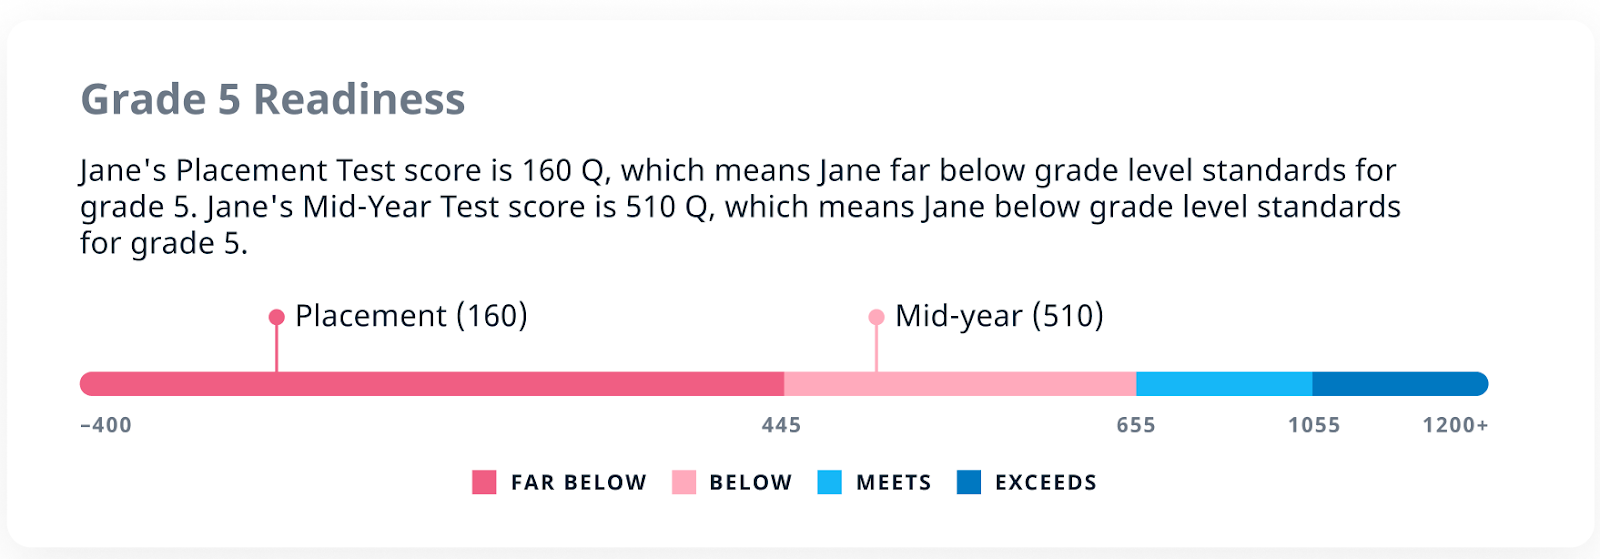
We’ve designed a separate Student Assessment Report to provide teachers with a convenient option to launch assessments and interpret the results. This dashboard lets you set the test dates and track the details on three formal assessments: Placement Test, Mid-Year Test, and End-of-Year Test.
Progress Report
The Progress Report tab includes more detailed information on each student’s learning pathway: starting point, modules, completed topics, and topics in process.
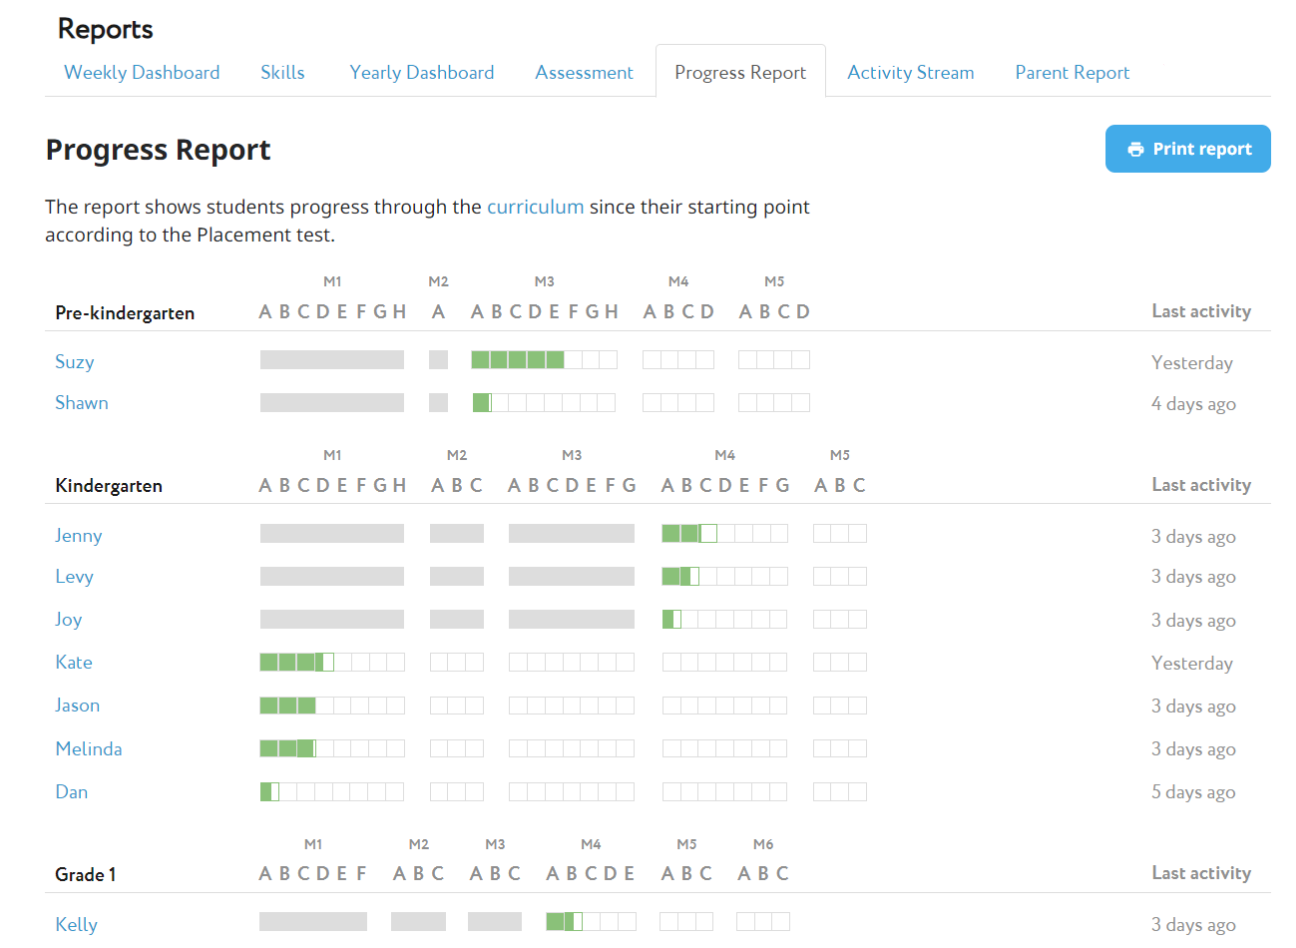
Note: gray sections indicate that the student has skipped them based on the Placement Test.
Note: You can print your detailed Progress Report by clicking ‘Print report’ in the upper right corner of the screen.
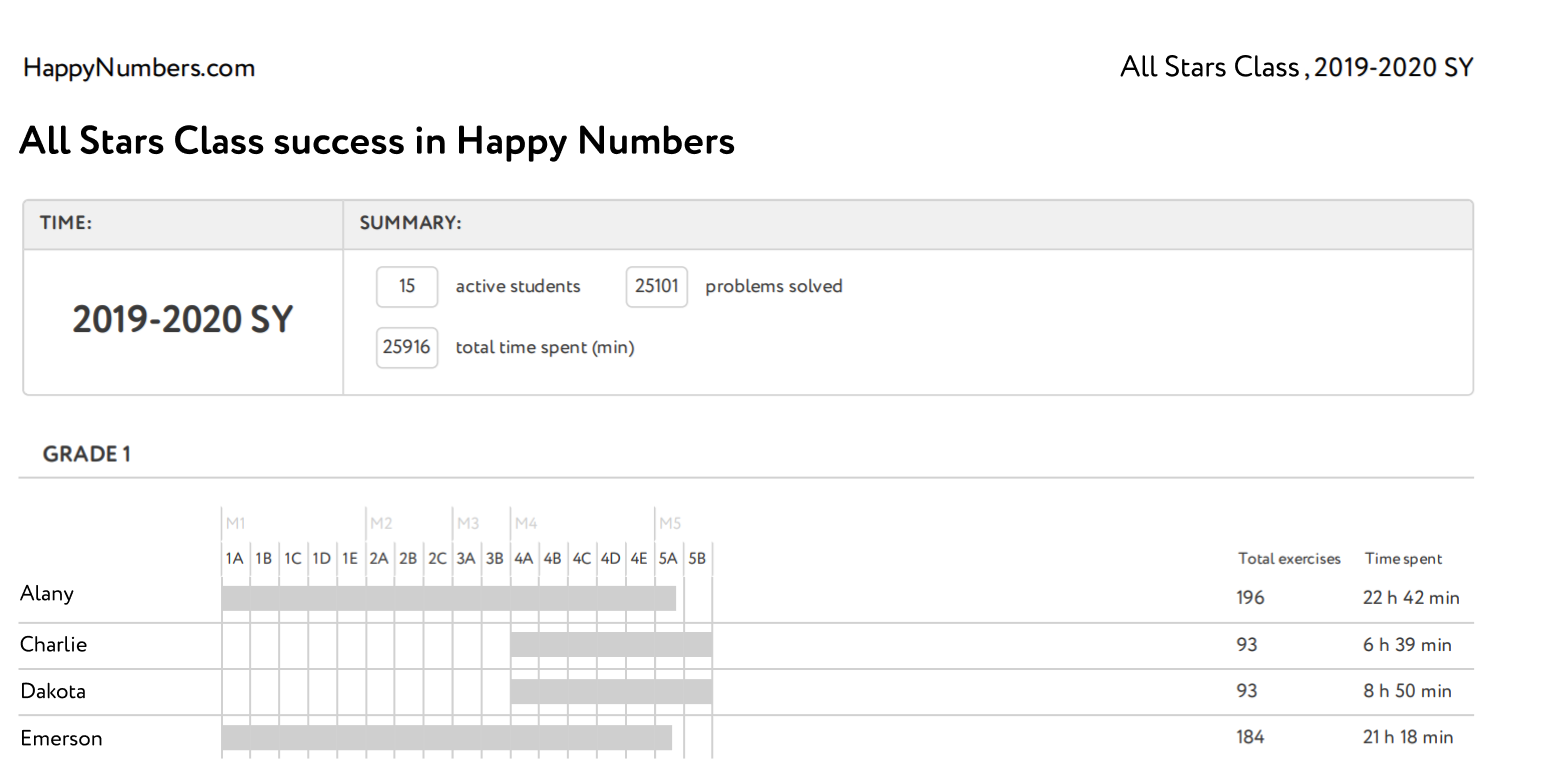
The printed report contains:
1) Summary: the number of active students (those who have finished the Placement Test and started exercises), how many problems your class solved, and total time spent;
2) Individual student overviews: starting point, current progress, total exercises (each exercise includes several problems), and total time spent.
Activity Stream
The Activity Stream is a clearly-structured report for teachers to use in assessing student progress, providing feedback to students, or sharing information with parents.
We explain how to access and interpret data at 3 different levels — class overview, class details, and individual — to drive your instruction with useful, actionable data.
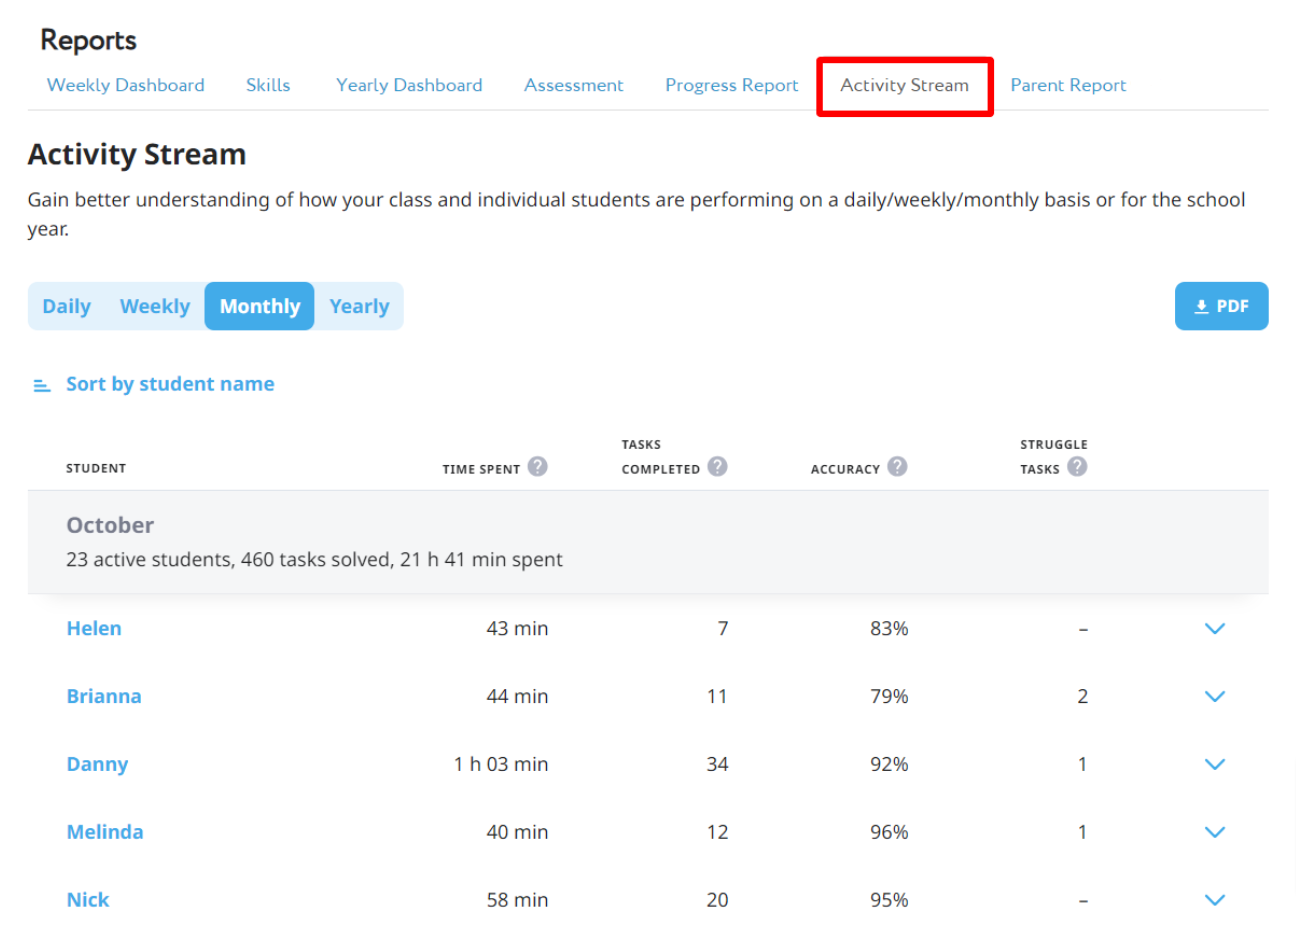
The Daily/Weekly/Monthly/Yearly buttons at the top right allow you to choose the period to observe. The report will show the activity of all students who have used Happy Numbers during the chosen period. Click ‘show details’ on the right to see more data about what exercises and how many of them were completed and how much time was spent. Select an individual student to see a detailed summary for that student.
Note: You can download the Activity Stream report by clicking ‘PDF’. You can either share the downloaded report via email or print it if a hard copy is needed.
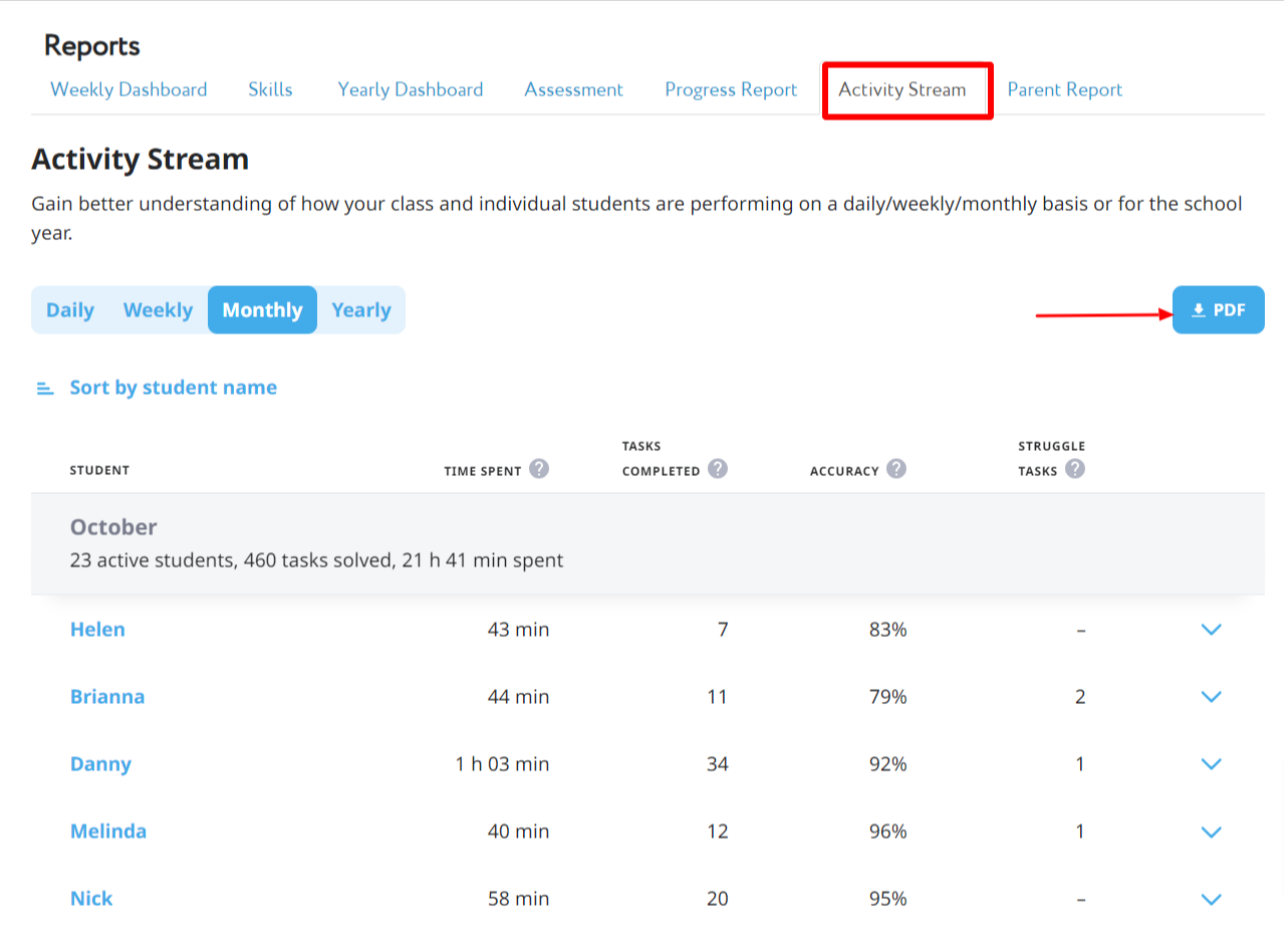
It contains detailed information for the chosen period.
Learn more about how teachers can use the Activity Stream here.
Parent Report
This customized student report illustrates a student's yearlong journey with Happy Numbers. It is designed to help parents and teachers better understand the student's curriculum progress, math growth, and next-grade-level readiness.
Learn more about the Parent report here.
Access to some reports and data may be limited depending on your license type. To learn more about the differences between license types and what features are available, please visit this page.